
How I keep a Mac system monitor under 0.3% CPU
A monitor that shows up in its own top-apps list has failed. Here is the design that keeps Stat Space under its idle budget.
By Zernonia · November 10, 2026 · 9 min read
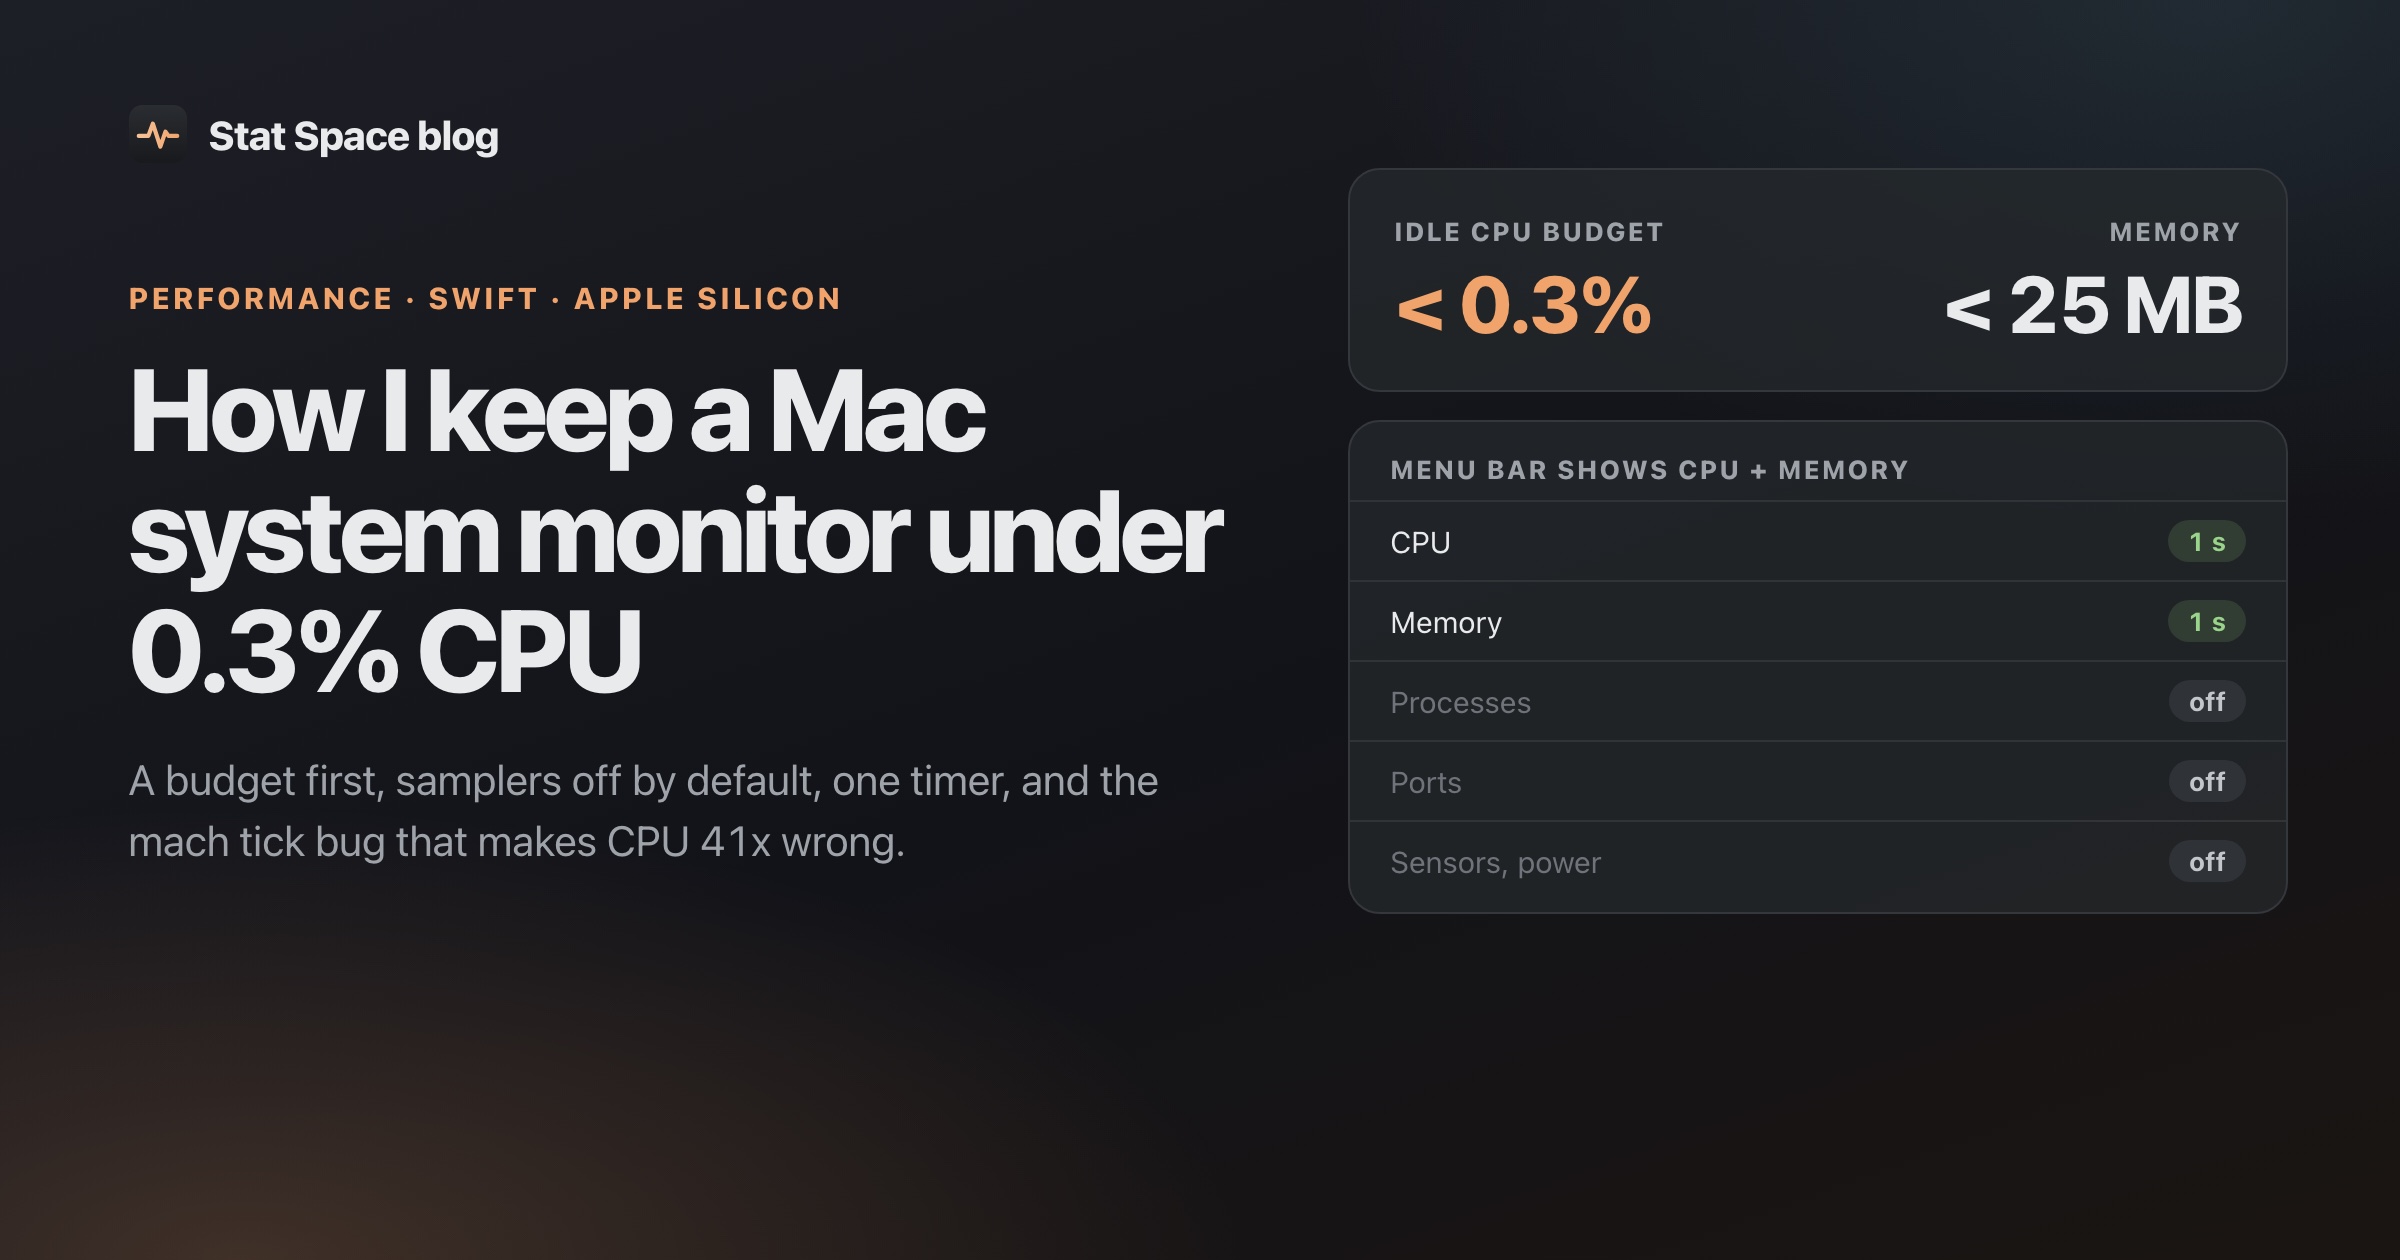
The first rule I wrote down for Stat Space wasn’t a feature. It was a number: under 0.3% of one core and under 25 MB at idle, on an M1, sampling every second with the popover closed. A system monitor that shows up in its own top-apps list has failed at the one thing it’s for.
This post is how that budget is actually met: what runs, what doesn’t, and the measurement that keeps me honest. None of it is exotic. Most of it is saying no to work.
Start with the budget, not the features
The budget lives in the project’s agent handover file and the spec, above any feature list:
- Under 0.3% CPU and under 25 MB at idle (M1, 1 s sampling, popover closed).
- Under 2% CPU with the popover open on Home.
- No allocations in the sampling hot path. Every series is a fixed-size ring buffer.
- A status item redraws only when its displayed value changes.
One detail I got wrong at first: “25 MB” of what? Raw RSS counts shared AppKit and SwiftUI framework pages, which is around 70 MB for any AppKit app before you write a line of code. That number measures macOS, not me. So the gate is phys_footprint, the value Activity Monitor shows in its Memory column. I logged that under “Decided” in the spec so I wouldn’t relitigate it later.
Nothing samples unless something needs it
The single biggest win is not sampling. Every data source is a pull-based Sampler with one method, sample(at:into:history:), and a Scheduler decides when to call it. The scheduler doesn’t have a list of “things to monitor”. It has a Demand:
public struct Demand: Sendable, Equatable {
    public var baseInterval: Double = 1     // user setting: 1, 2 or 5 s
    public var popoverOpen: Bool = false
    public var menuBar: SamplerSet = []     // feeding a menu bar item
    public var visible: SamplerSet = []     // the open tab, or Home's pins
    public var background: SamplerSet = []  // rules, alerts, agent watch, CLI
}
The app recomputes demand whenever the menu bar layout, the popover, pins, rules or alerts change. A pure function then maps each sampler plus demand to an interval, or nil for off. A few rows of that policy:
| Sampler | Popover open | Menu bar shows it | Only a background rule needs it | Nobody needs it |
|---|---|---|---|---|
| CPU, memory, network, disk, GPU | 1 s | user setting | 5 s or slower | off |
| Processes | 2 s | n/a | 10 s | off |
| Ports | 3 s | 15 s | 15 s | off |
| Sensors, power | 2 s | 5 s | 10 s | off |
| Wi-Fi | 2 s | n/a | never | off |
So if you only show CPU and memory in the menu bar, the process walk, the port scan, the sensor reads and per-app network don’t run at all. Closing a tab suspends its samplers, and they get a chance to drop caches and handles.
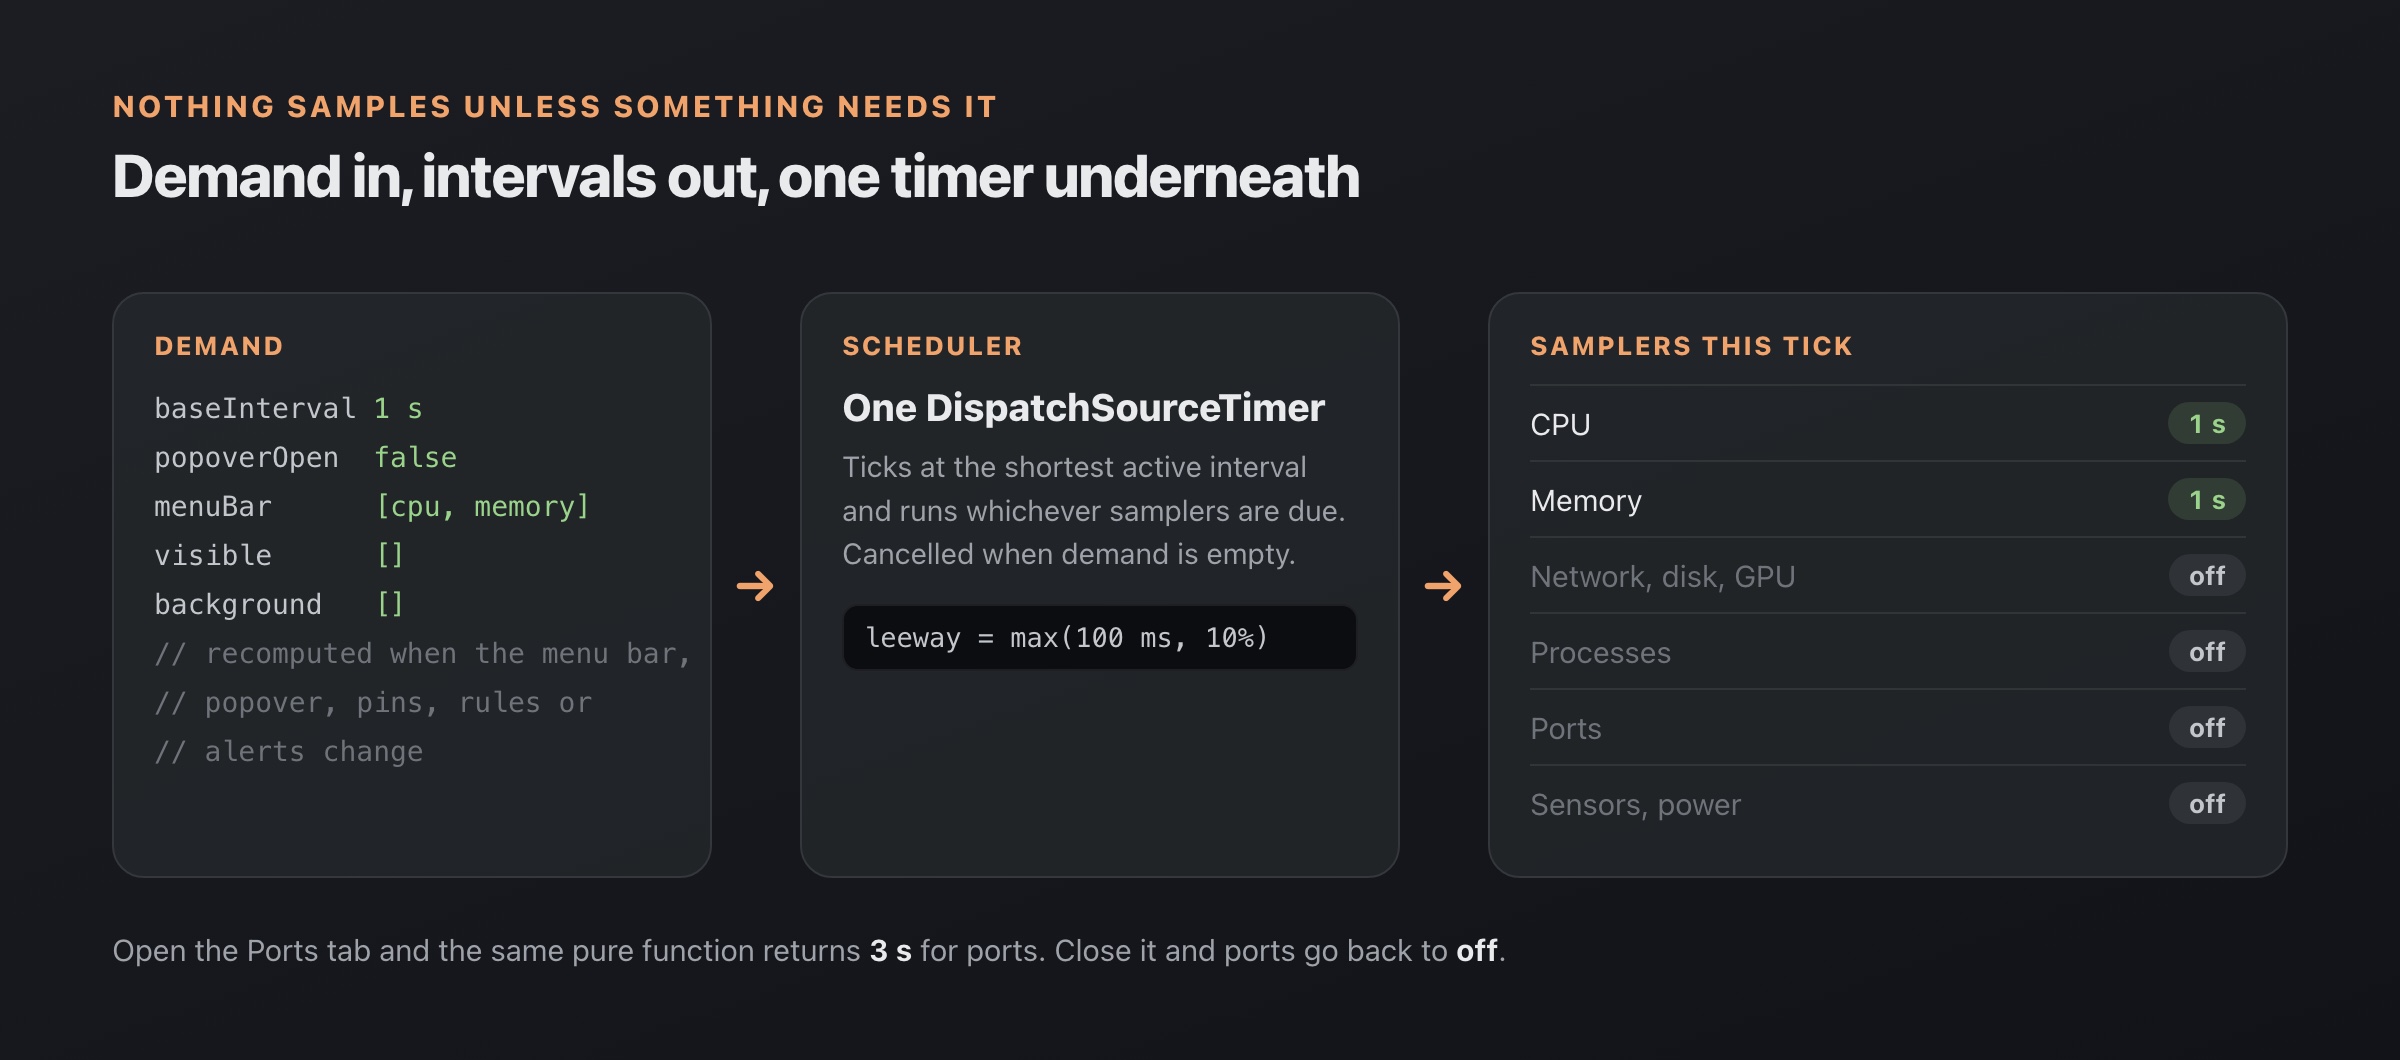
With only CPU and memory in the menu bar, every other sampler is off.
There’s also a “lite” mode for the cases where something runs in the background. Agent watch and orphan sweep only care about your own command-line processes, so with the popover closed the process sampler reads usage just for those and skips app grouping, with an occasional full pass so CPU deltas have a fresh baseline when you open the popover.
One timer, with leeway
All of those samplers hang off a single DispatchSourceTimer. It ticks at the shortest active interval, and on each tick runs whichever samplers are due. When demand drops to nothing, the timer is cancelled entirely.
The part that matters for idle cost is the leeway:
// Generous leeway (10%, at least 100 ms) lets macOS coalesce our wakeups.
let leeway = DispatchTimeInterval.milliseconds(max(100, Int(iv * 100)))
t.schedule(deadline: .now() + iv, repeating: iv, leeway: leeway)
A menu bar number doesn’t need to update at exactly 1.000 s. Telling the kernel it can slide the wakeup lets it batch ours with everyone else’s, which is the cheapest CPU time there is. The tick also tolerates firing a little early (a 150 ms slack) so a coalesced wakeup still counts.
Long-term history follows the same idea. A separate recorder samples once a minute on the same queue, so 30 days of history costs one wakeup a minute and never changes what the live samplers do.
One Snapshot, overwritten in place
There is exactly one live Snapshot struct, owned by a Store and confined to the sampling queue. Samplers write into it in place. Arrays inside it (processes, ports, apps) are refilled with removeAll(keepingCapacity: true), so a steady-state tick reuses the same storage instead of reallocating.
History is a set of fixed-size ring buffers, 300 points each:
@inline(__always)
public mutating func append(_ v: Float) {
    values[head] = v
    head += 1
    if head == values.count { head = 0 }
    if count < values.count { count += 1 }
}
Storage is a ContiguousArray<Float> allocated once at init. append never grows it. Reads for sparklines walk it with a closure (forEachRecent) rather than building an array; the one method that copies into a new array is labeled “UI use only”.
The crossing to the main thread matters too. With the popover closed, the menu bar gets a Pulse: a struct of scalars. Per-core CPU goes into a SIMD32<Float> instead of an array, because a fixed-size vector doesn’t allocate and an [Float] does. The full snapshot and history are only handed to the main thread while the popover is open.
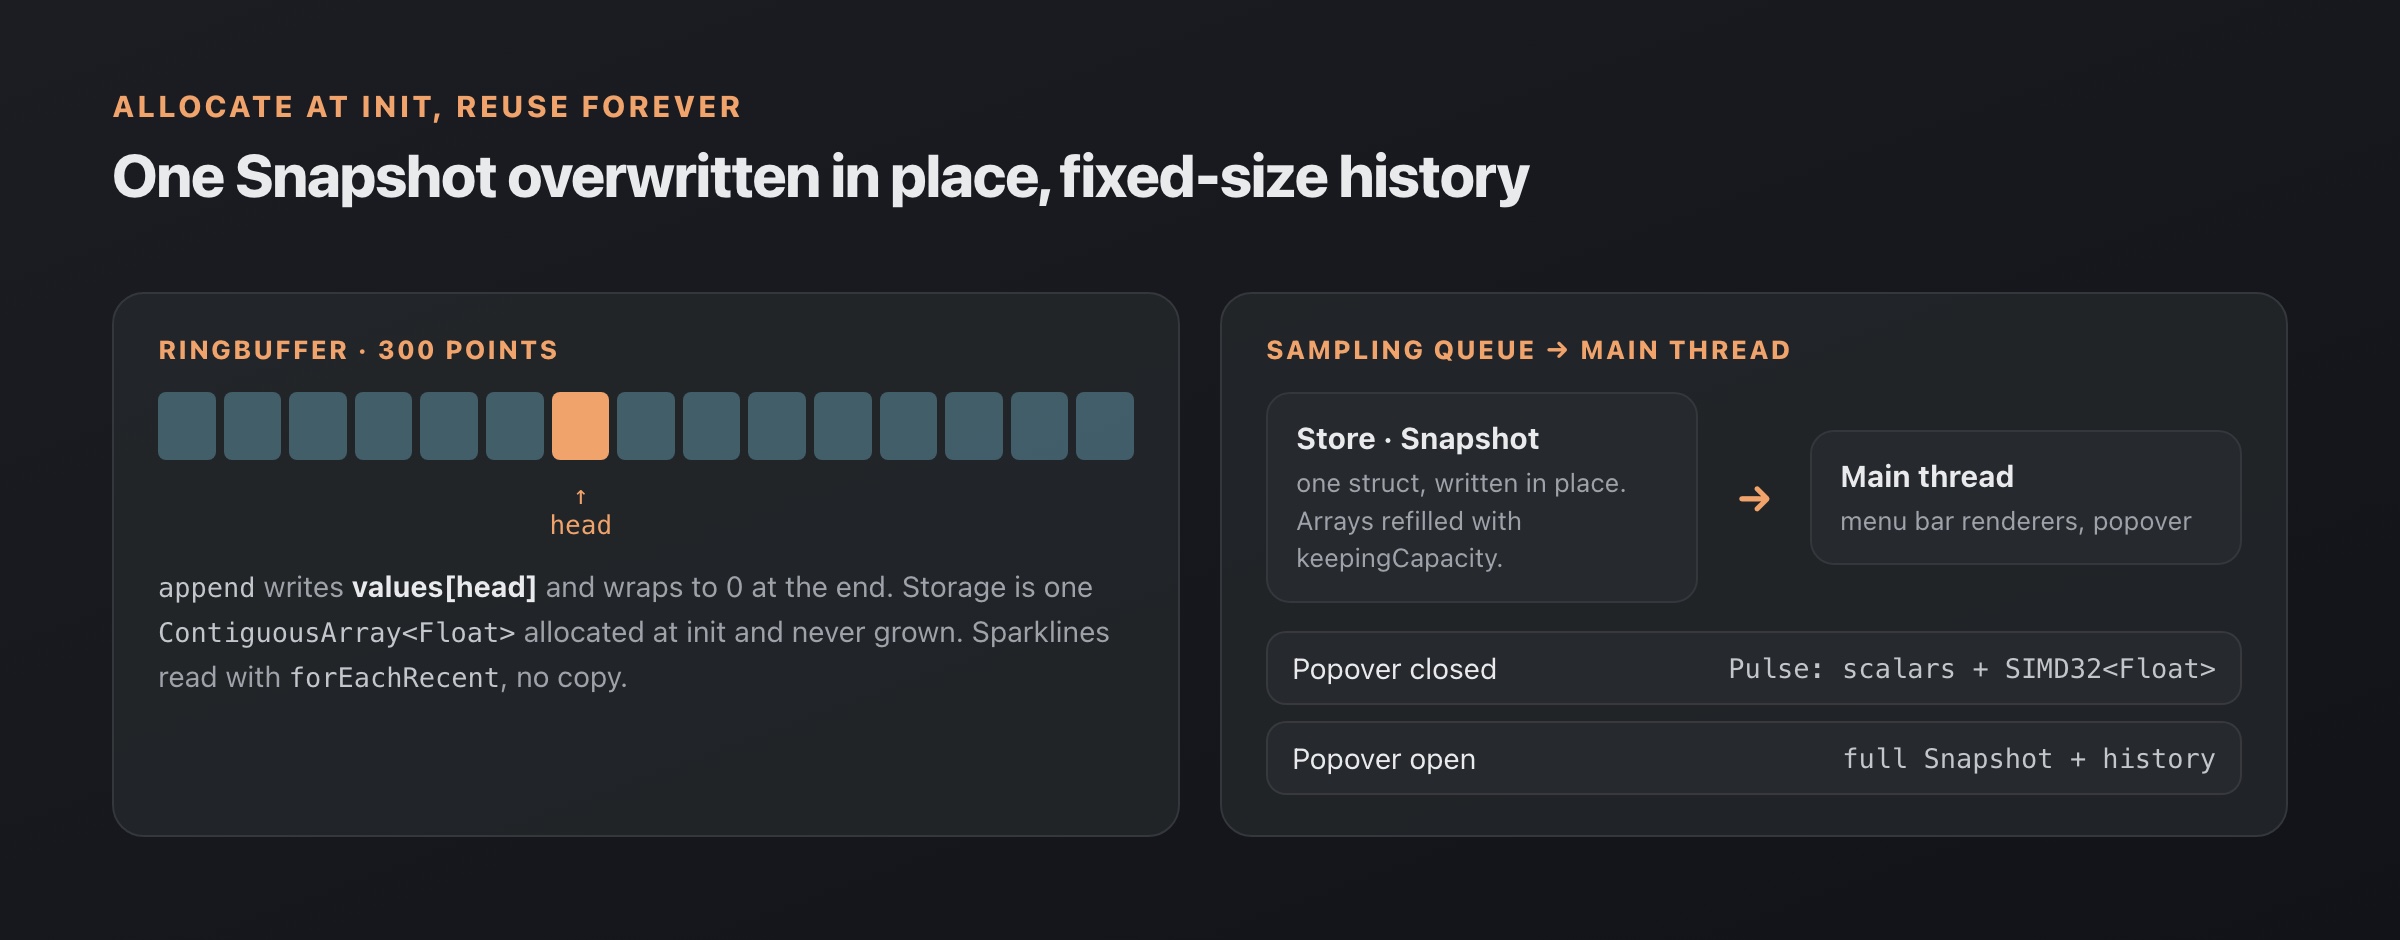
History lives in fixed-size ring buffers, and only scalars cross to the main thread while the popover is closed.
The menu bar is Core Graphics, the popover is temporary
The menu bar items are plain NSStatusItems with images drawn by Core Graphics. No SwiftUI, no MenuBarExtra. Each item’s renderer builds a small value describing what it would draw, compares it with the last one, and returns nothing if they match:
func renderIfChanged() -> MenuBarRender? {
    let r = currentRender()
    if r == lastRender { return nil }
    lastRender = r
    return r
}
If a plain number item shows 4% for ten seconds, that’s ten comparisons and zero redraws.
SwiftUI lives only inside the popover, and only while it’s open. The panel, the hosting view and the popover’s model are created on open, and closing releases all three, so the popover-closed path holds no SwiftUI state at all. Opening is a little more work each time. I’ll take that over a view hierarchy sitting in memory all day for a window you look at a few times an hour.
Port scanning without a port-scanning bill
The Ports tab lists every listening TCP socket with the process and project behind it, without root. The API is libproc: proc_pidinfo(PROC_PIDLISTFDS) to get a process’s file descriptors, then proc_pidfdinfo(PROC_PIDFDSOCKETINFO) on each socket fd to see whether it’s a TCP listener.
Doing that for every fd of every process every few seconds adds up. Two rules make it cheap:
- Cache by fd count.
PROC_PIDLISTFDSis one syscall per pid and always runs. The per-fd socket calls run only for pids that are new or whose fd count changed since the last scan. Otherwise the cached sockets are reused. A full rescan every 60 s catches the rare case of a socket swapped for another at an unchanged count. - Remember EPERM. Other users’ processes (root daemons, mostly) refuse
PROC_PIDLISTFDSwithEPERM. The scanner marks those pids as denied and skips them until they exit, instead of asking again every scan.
Pid reuse is handled by keying the cache on start time as well as pid. The fd buffer is one raw allocation that grows only if a process has more fds than it holds, and stays grown. When you do want root-owned listeners, 1.4.0 added an opt-in “System ports” view that asks for your password once and runs a read-only lsof, as a snapshot that never refreshes on its own, so the idle budget doesn’t move. More on the feature at https://statspace.app/features/ports.
The Apple Silicon bug that makes CPU numbers 41x wrong
This one is worth a section because almost everyone hits it. proc_pid_rusage gives you ri_user_time and ri_system_time. On Intel those are nanoseconds. On Apple Silicon they are mach absolute-time ticks, which run at 24 MHz. mach_timebase_info reports 125/3 on M1, so if you treat ticks as nanoseconds your CPU percentages come out about 41.7 times too small.
It’s a nasty bug because the numbers look plausible. A busy process shows 2% instead of 80%, and nothing crashes.
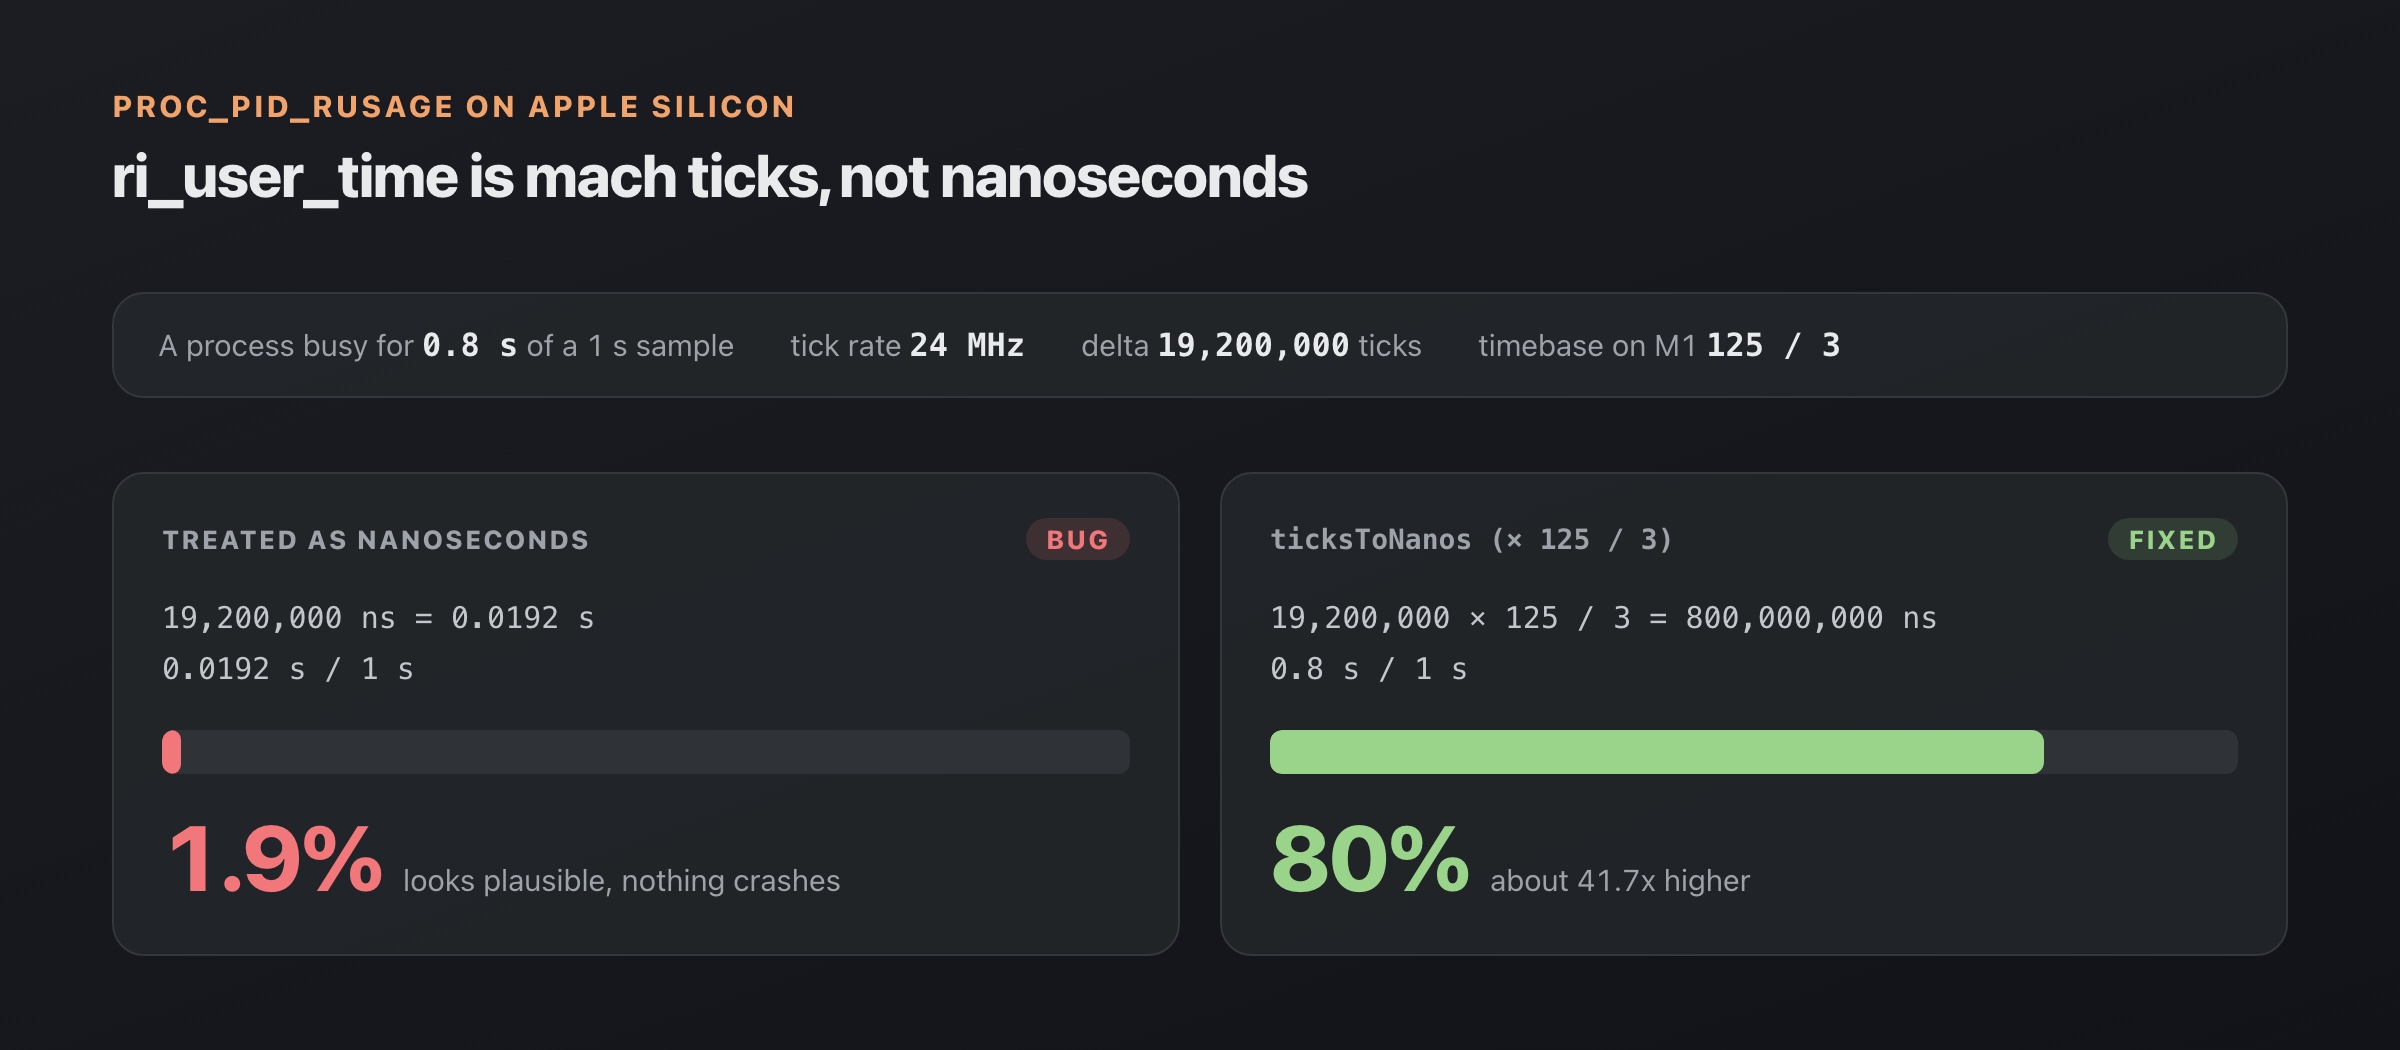
The same rusage delta, read as nanoseconds and correctly converted from 24 MHz ticks. Every path in Stat Space that reads CPU time goes through one helper:
public static func ticksToNanos(_ ticks: UInt64) -> UInt64 {
    let tb = timebase                       // mach_timebase_info, read once
    if tb.numer == tb.denom { return ticks }
    let wide = ticks.multipliedFullWidth(by: UInt64(tb.numer))
    return UInt64(tb.denom).dividingFullWidth(wide).quotient
}
The 128-bit intermediate is there so long-running totals can’t overflow. The same conversion applies to pti_total_user / pti_total_system from proc_pidinfo(PROC_PIDTASKINFO), the fallback when rusage isn’t readable.
Measuring from the outside
Budgets that aren’t measured are wishes. There are two measurements.
The self-cost probe. Stat Space samples its own proc_pid_rusage and shows its CPU and memory in the popover footer, always. It runs at 1 s while the popover is open and every 5 s otherwise. If it ever costs too much, the user sees it before I do.
The idle-cost benchmark. A script launches the bundled app with default menu bar items and the popover closed and waits out a warm-up. Then a separate tool, pulse-bench, reads the app’s rusage every second for 60 s from another process. It prints mean, p95 and max for CPU, RSS and phys_footprint, and exits non-zero when mean CPU or max memory is over budget. Because it measures from outside, it catches costs the app can’t see in itself, like work done by its own run loop or framework threads.
Inside the app, the scheduler also keeps a cheap cost breakdown: two clock reads around each sampler run, reported as each sampler’s share of one core. When the benchmark fails, that table usually says which sampler did it.
I’ll be honest about the CI part. GitHub’s macOS runners are virtualized and noisy: the same commit has measured 0.26% and 0.81% on them. So the CI job gates at a looser 0.6% to catch large regressions, also captures a 10 s call-tree profile of the idle app, and the real 0.3% / 25 MB gate is run on M1 hardware before a release. macOS minutes are expensive too, so that job runs on demand before tagging rather than on every push. A benchmark that flaps gets ignored, and an ignored benchmark is worse than none.
What I’d tell someone building one
- Write the budget first and make it a failing test, not a goal.
- Make “off” the default state of every sampler. Derive what runs from what’s visible.
- One timer, generous leeway. Let the kernel batch you.
- Allocate at init, reuse forever. Fixed-size buffers,
keepingCapacity, scalars across threads. - Cache the expensive per-process facts and only resolve new pids.
- Convert mach ticks on Apple Silicon. Then check it again.
- Gate memory on
phys_footprint, not RSS.
If you want to see where this ended up, the lightweight monitor roundup at https://statspace.app/best/lightweight-system-monitor-mac compares it with the alternatives.
Stat Space is the menu bar monitor I built around these rules: free, with a one-time Pro upgrade, for Apple Silicon. It shows its own cost in the footer so you can check every number in this post yourself. It’s at https://statspace.app.
Questions
Why measure memory as phys_footprint instead of RSS?
Raw RSS counts shared AppKit and SwiftUI framework pages, roughly 70 MB for any AppKit app, so it says more about macOS than about your code. phys_footprint is what Activity Monitor shows in its Memory column.
Why does proc_pid_rusage report CPU time that is far too low on Apple Silicon?
On Apple Silicon ri_user_time and ri_system_time are mach absolute-time ticks (24 MHz), not nanoseconds. Multiply by mach_timebase_info's numer/denom (125/3 on M1) or your values come out about 41.7 times too small.
Know what your Mac is doing, without adding to it.
Free, no account. Pro is $9.99 once for the first 100 buyers.