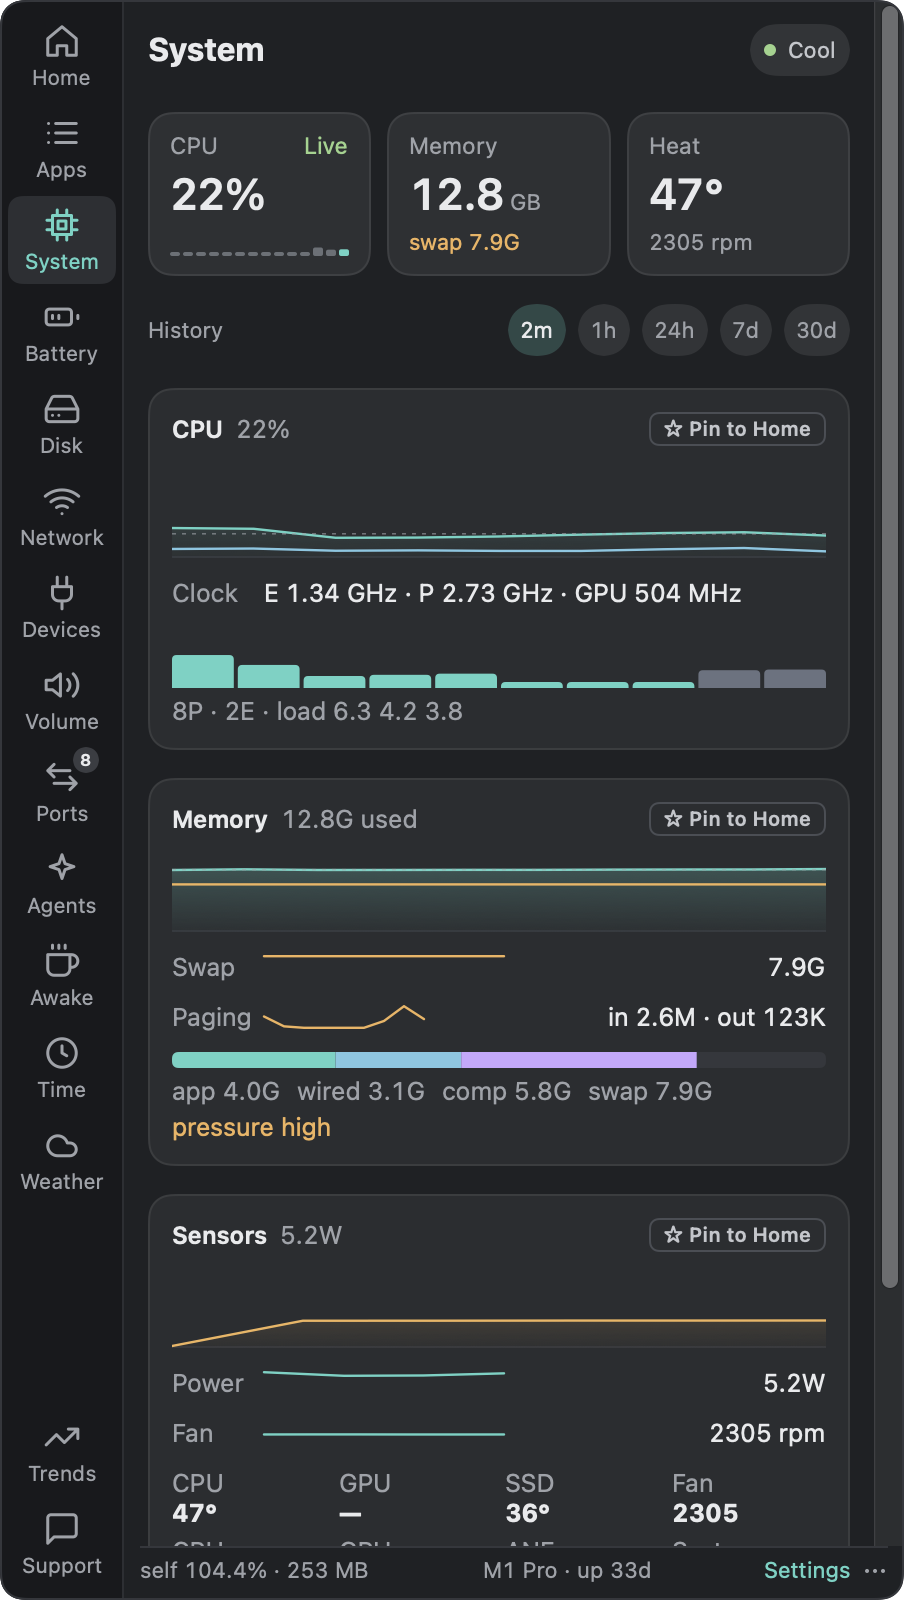
Twelve looks to start from, thirteen ways to draw each number, a combined item, and every detail adjustable after that.
Every image on this page is drawn by Stat Space's own menu bar renderer.
Finder File Edit View Go WindowSat 7 Nov 10:32
01Looks
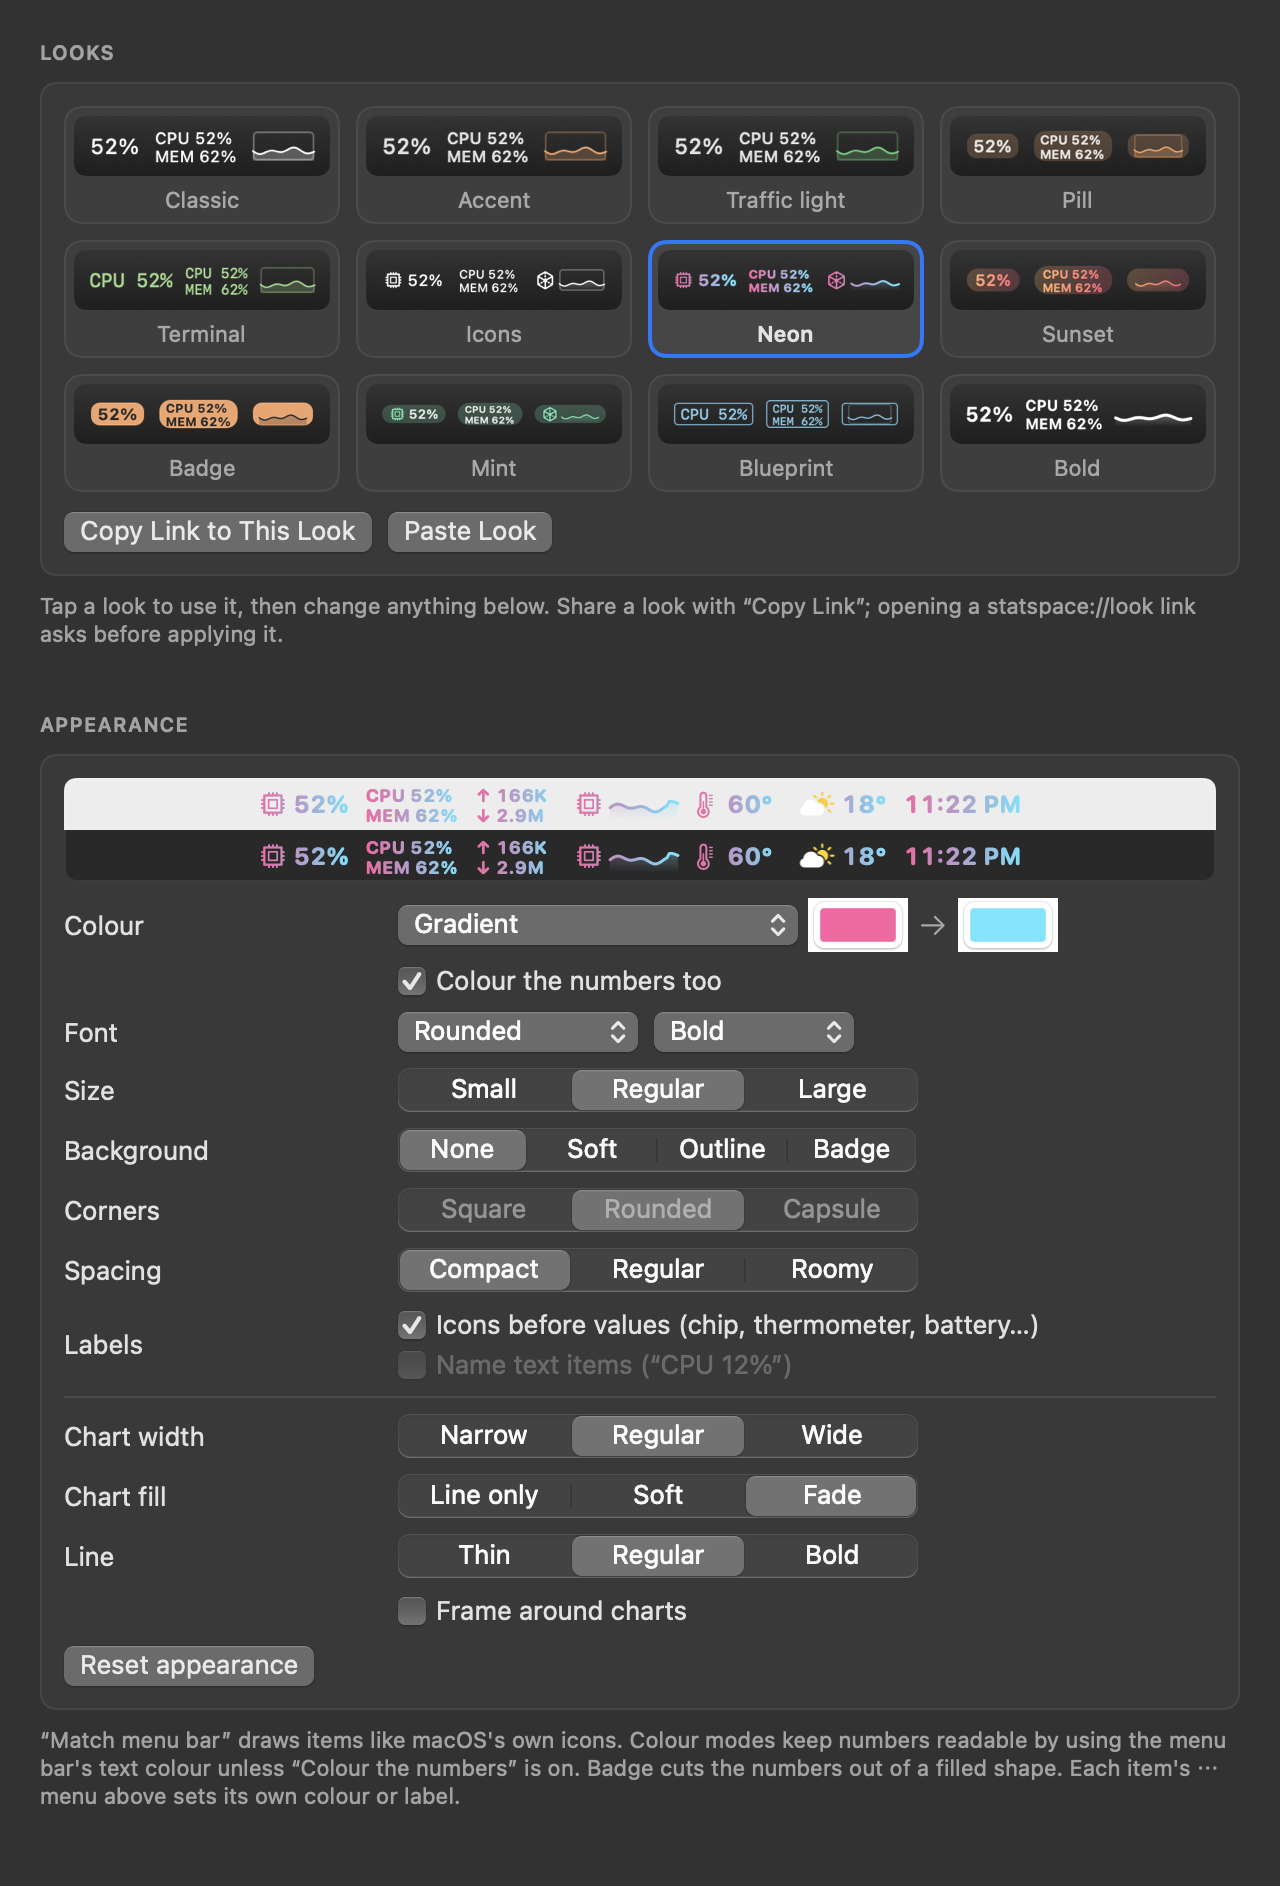
Twelve looks, one tap each.
Settings › Menu Bar › Looks. With Stat Space installed, “Open in Stat Space” shows the look and asks before it changes anything. Your items and their order stay the same.
Classic
Drawn like macOS’s own icons. Tints itself for light and dark menu bars.
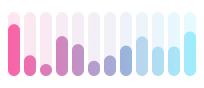
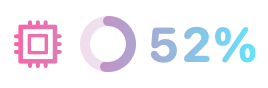
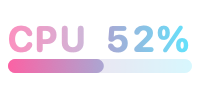
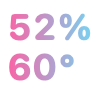
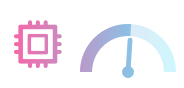
Each item picks its own style. Here is CPU in every one of them, plus network as an up/down graph and the battery as a battery. Per core, Up/down graph, Battery, Ring, Meter and Chart + value are new.
Text
Mini
Line chart
Bar chart
Chart + valueNew
Per coreNew
Pie
RingNew
MeterNew
Stack
Tachometer
Up/down graphNew
BatteryNew
03Combined item
Your whole Mac in one item.
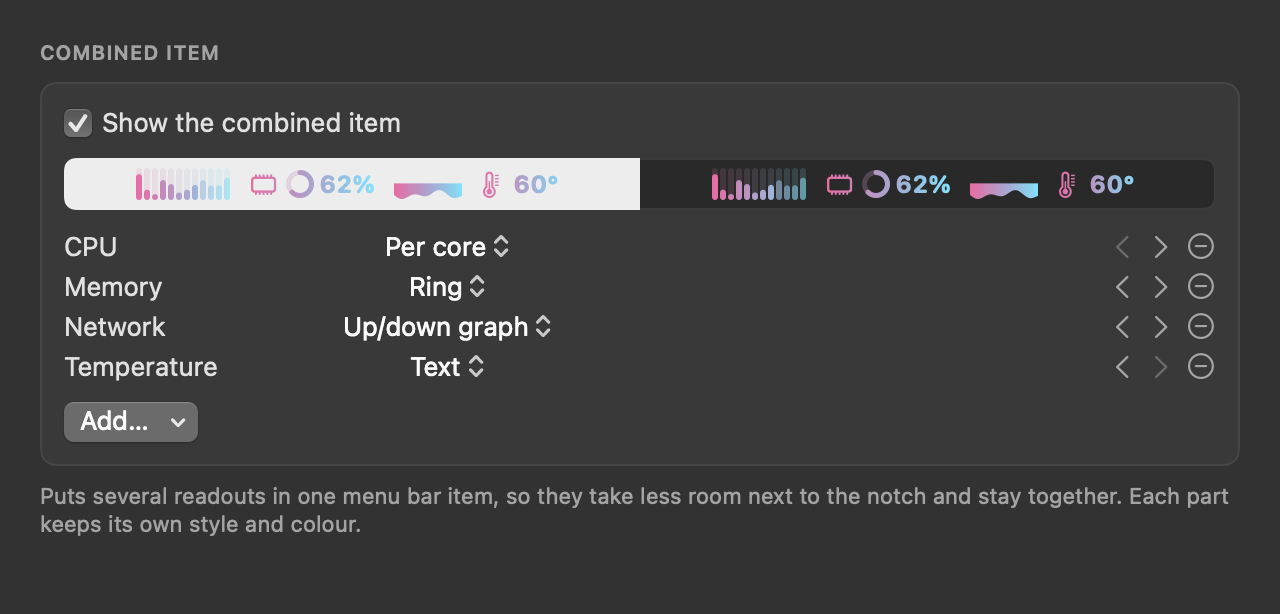
Pack several readings into a single menu bar item and order them however you like, each part in its own style. One click opens the popover; the menu bar stays short.
System Per-core CPU, a memory ring, an up/down network graph and the temperature.
Glance CPU and memory rings, the battery and the weather.
Developer CPU chart + value, GPU bars, network speed, a disk read/write graph and power.
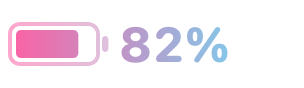
Battery, drawn as a battery
It empties as it drains, turns green while charging and red when low (gradient looks keep their gradient), with the percentage beside it.
On battery
Charging
Low
04By load
Quiet until it matters.
The Traffic light look keeps calm values in the menu bar's own colour, then moves through green, amber and red as CPU, GPU, heat, memory pressure and battery get worse. You notice a runaway build without reading a number.
Idle
Building
Something is stuck
05Time and weather
World clock and weather, your format.
Up to several zones with your labels, city names, flags or UTC offsets; tiny clock faces or sun and moon; 12 or 24 hours. Weather shows exactly the fields you pick, and swaps in “Rain in 12 min” when rain is coming.
World clock
Your labels
Clock faces
Flags, sun and moon
Short names, 24-hour
Date and time
Two zones stacked
Weather
Temperature
With the condition
High/low, rain, humidity
Feels like and place
Two lines
06Popover
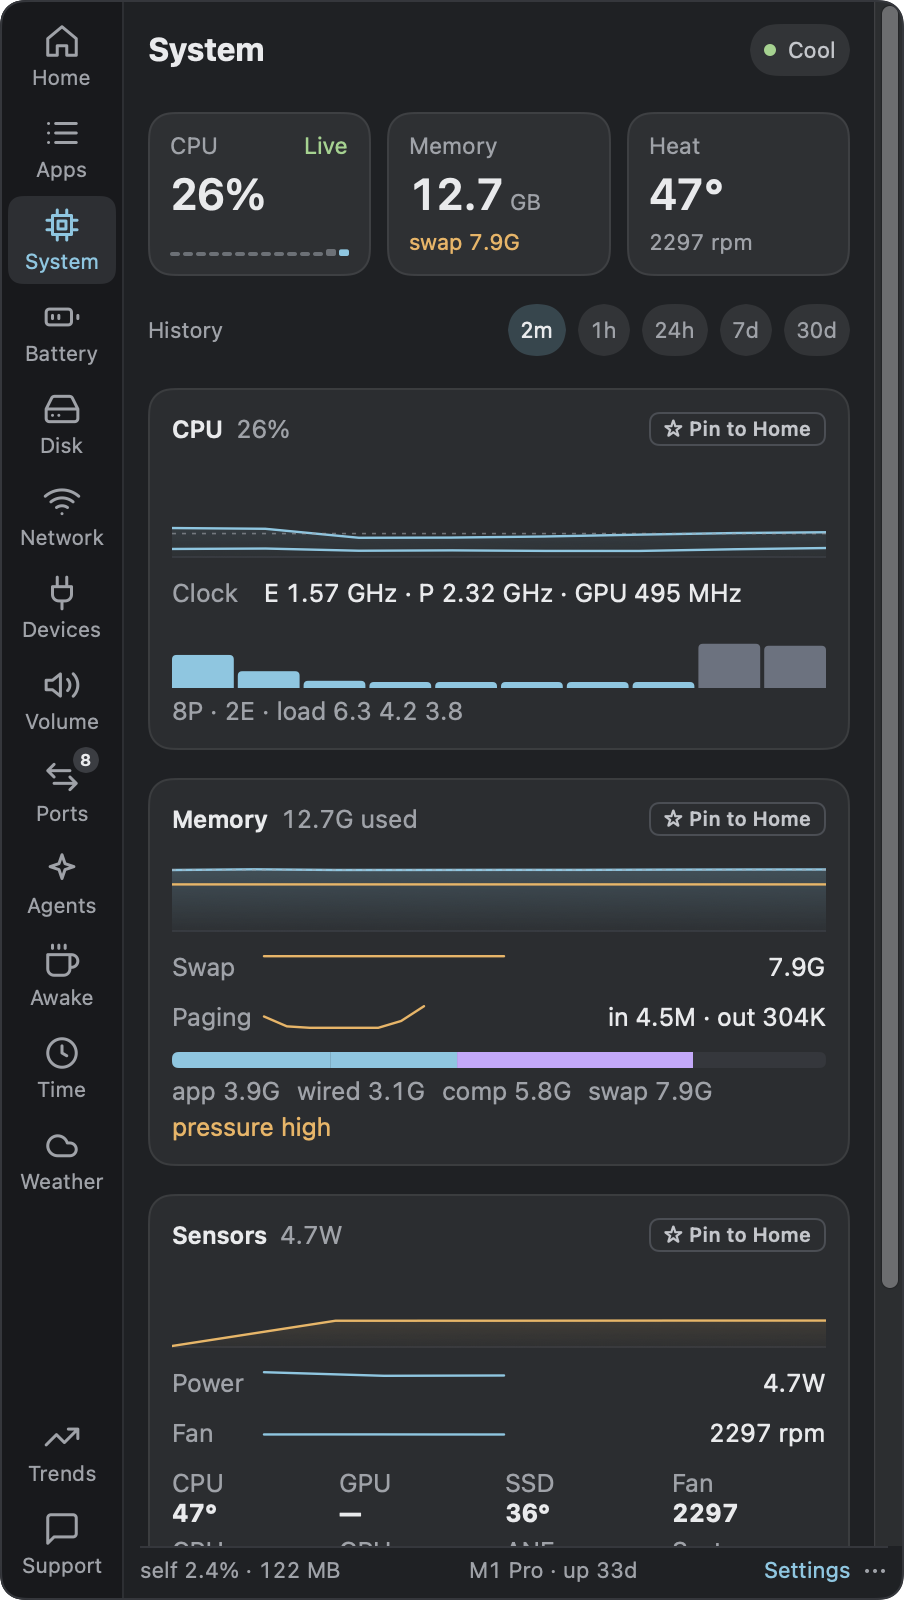
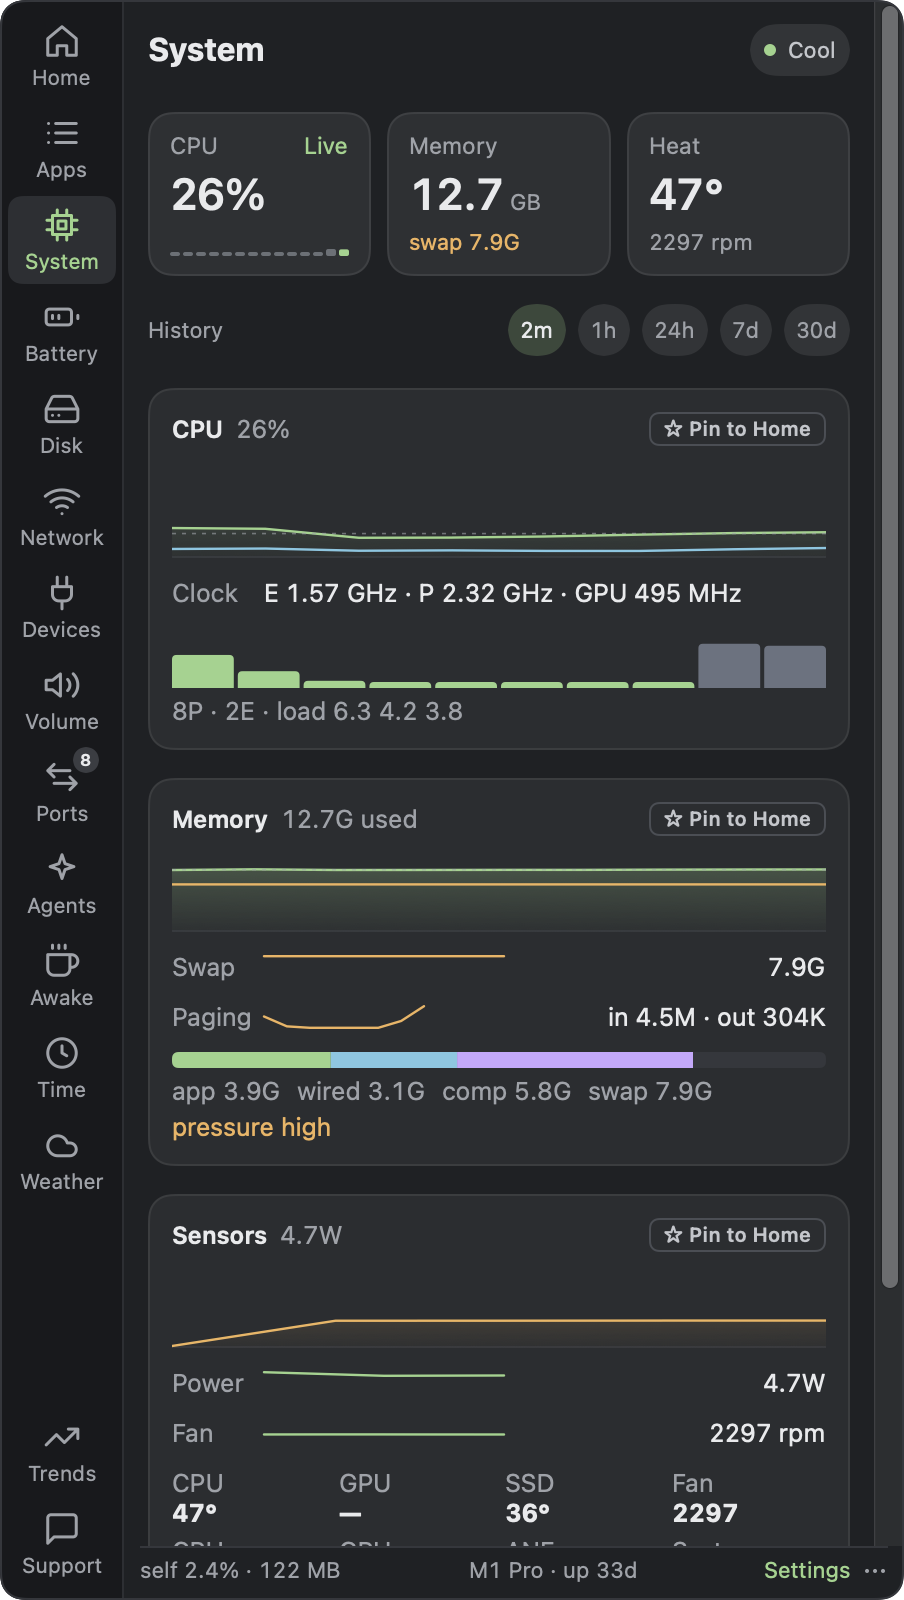
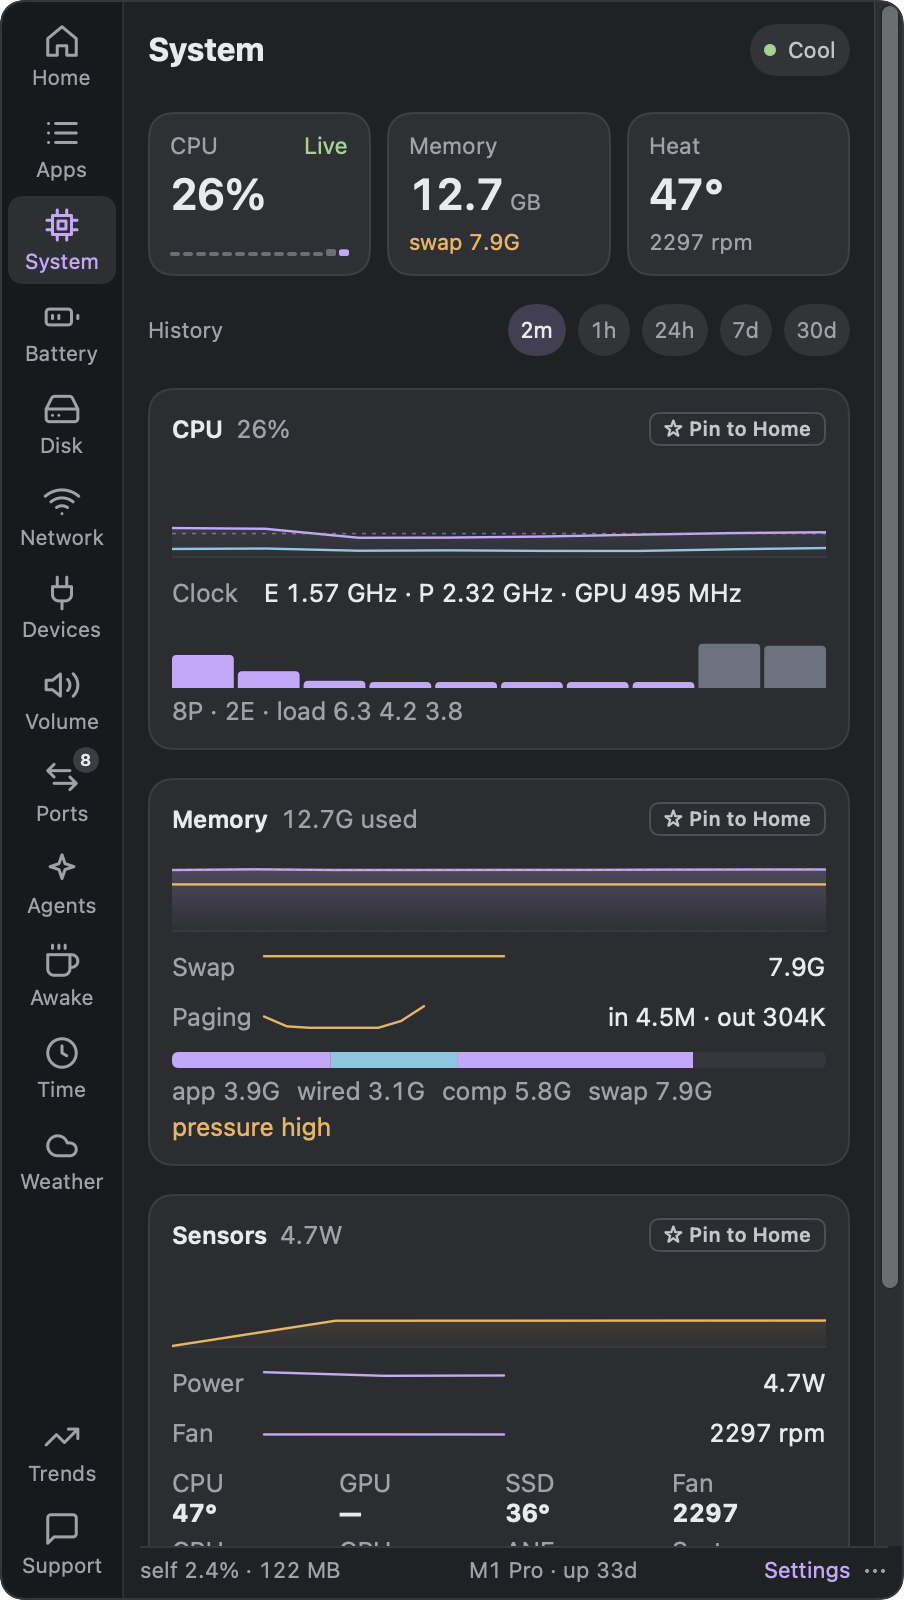
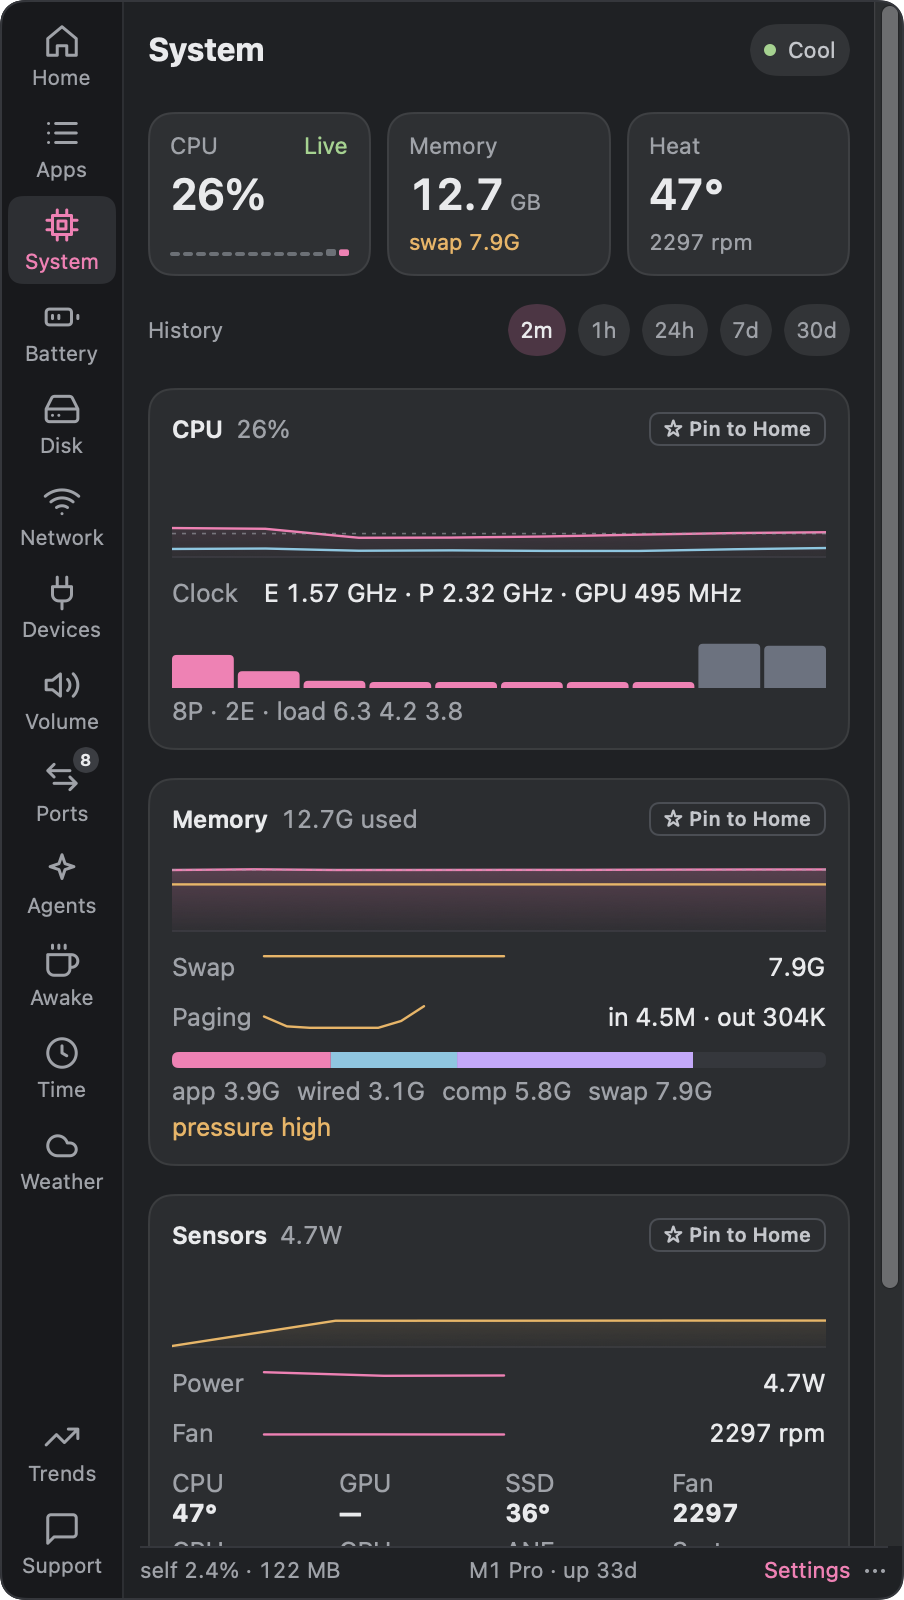
The popover follows your accent.
Eight accent colours or any colour you like, colour-blind-safe chart colours, Compact or Loose layouts, and a solid, glass or picture background.
AmberSkyLeafLilacPinkTeal
07Every detail
Start from a look. Change anything.
Colour. Match the menu bar, your accent, any colour, a two-colour gradient, or green → red by load.
Type. System, rounded or monospaced; small, regular or large; regular to bold.
Background. None, a soft pill, an outline, or a solid badge with the numbers cut out. Square, rounded or capsule corners.
Icons. An SF Symbol before each value: chip, memory, thermometer, a battery that empties as it drains.
Charts. Narrow to wide, line only, soft or faded fill, thin to bold lines, with or without a frame.
Per item. Give any item its own colour or label, and pick its style from up to thirteen.
Share it. “Copy Link to This Look” makes a statspace://look link. Post it, and anyone with Stat Space can open your look.