
Reading Apple Silicon temperatures, watts and clocks without sudo
The data powermetrics prints is reachable from a normal user process. The catch is that two of the three doors are private APIs.
By Zernonia · November 10, 2026 · 9 min read
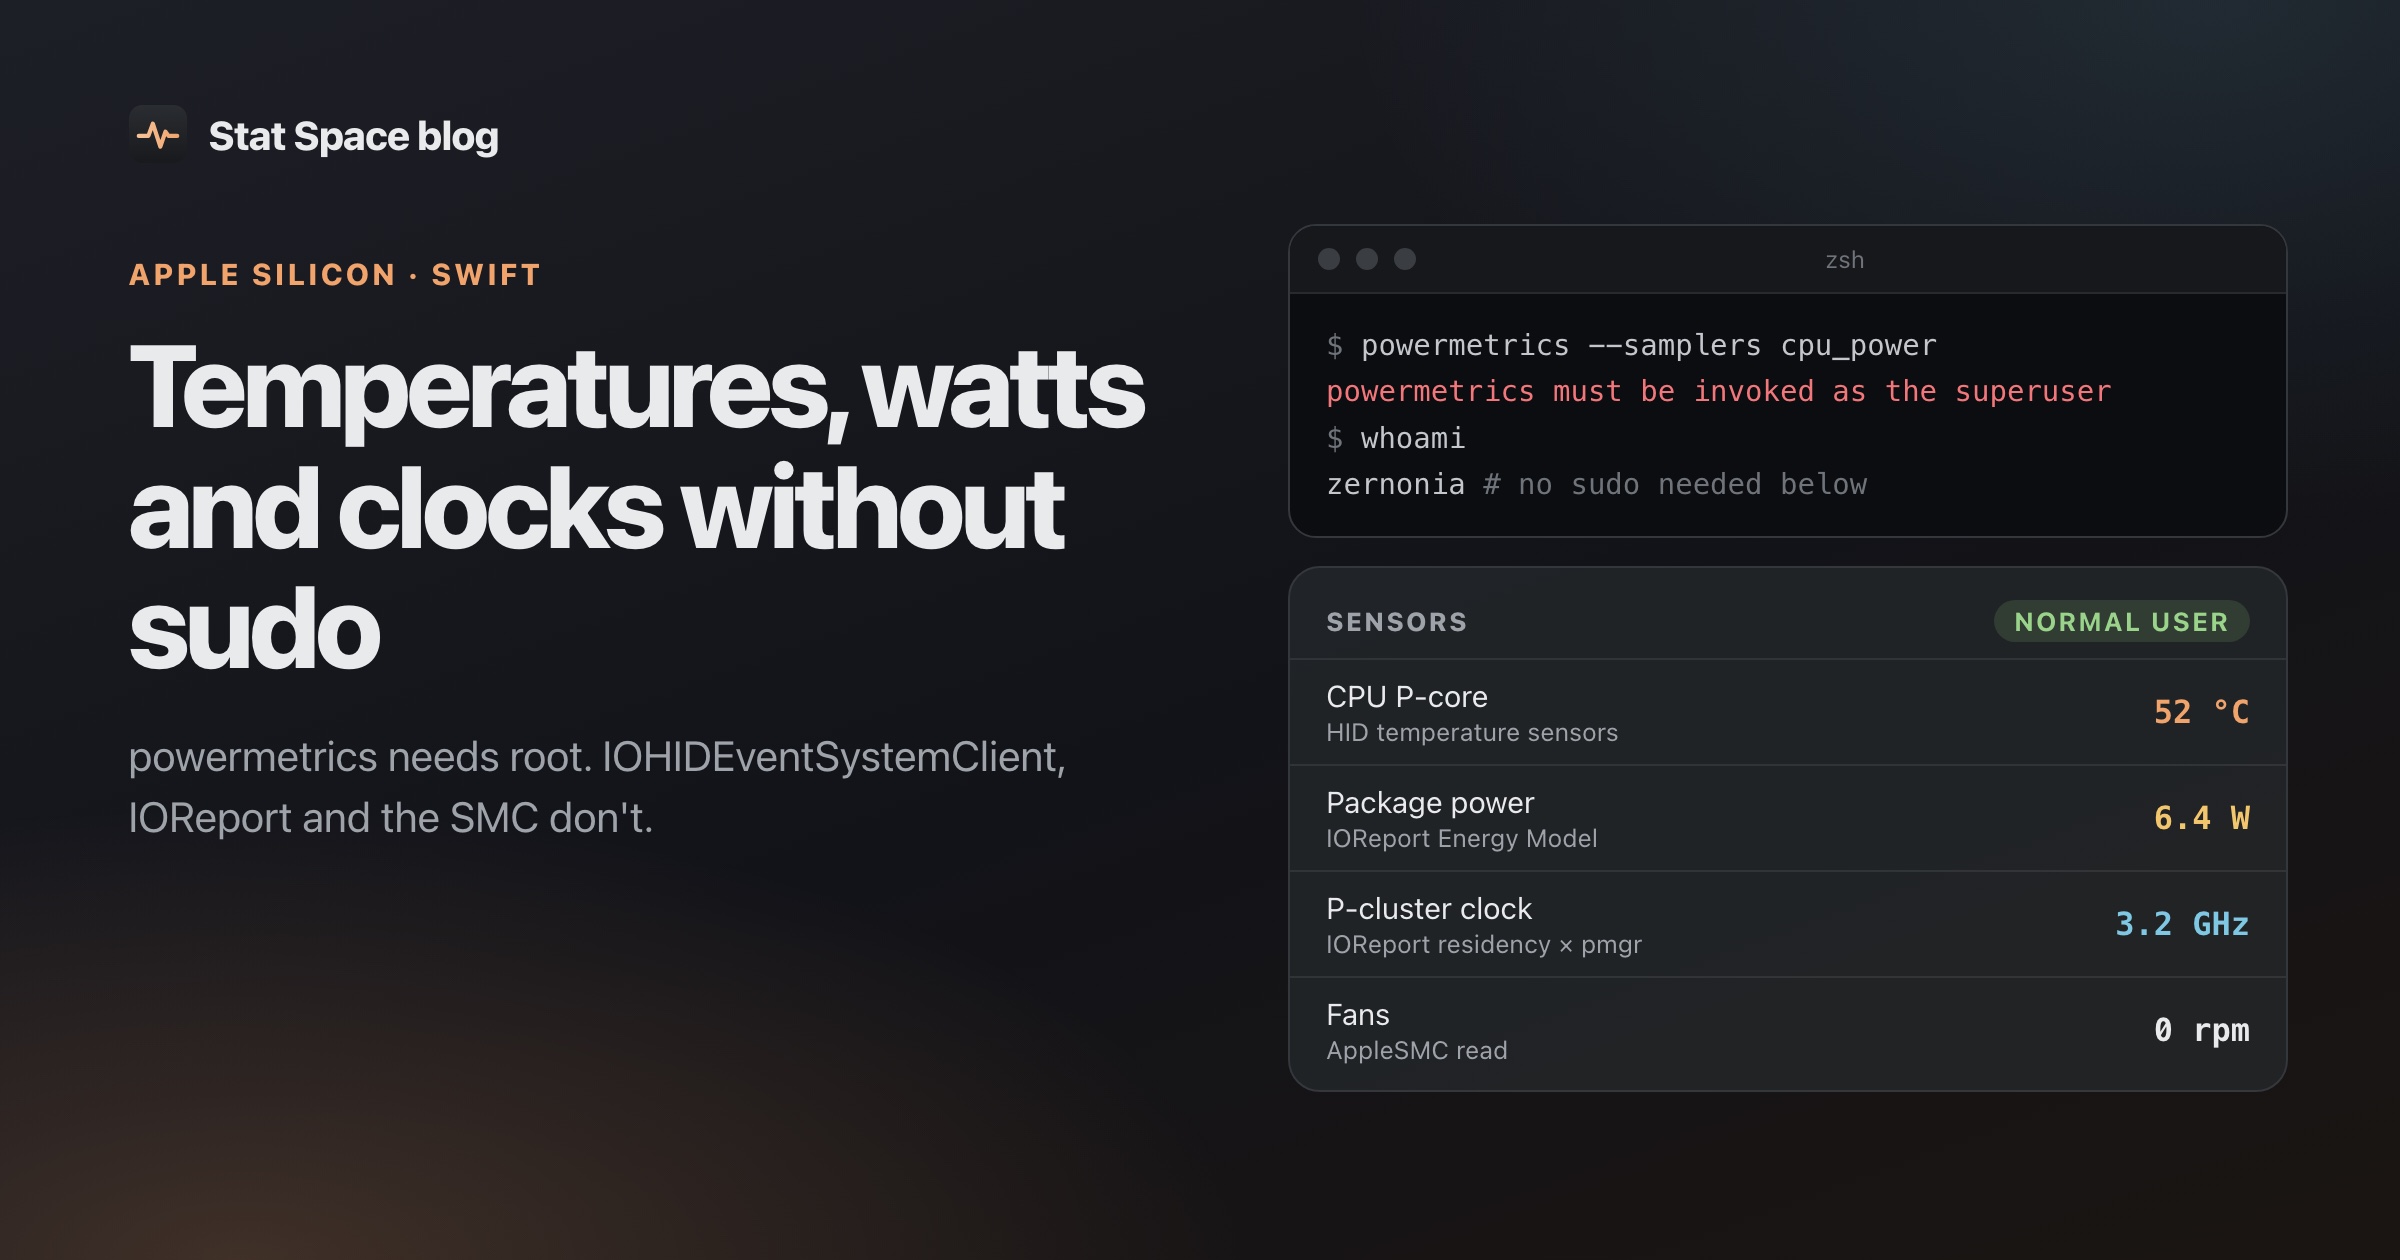
Run powermetrics on a Mac and the first thing it tells you is powermetrics must be invoked as the superuser. For a one-off check that’s fine. For a menu bar app that wants to show CPU temperature and package watts all day, asking for root is a non-starter: no one should hand a system monitor a privileged daemon just to read a thermometer.
While building Stat Space I wanted temperatures, power per rail, CPU and GPU clocks, and fan speeds, all as a normal user process. It’s possible. Here’s what each number actually comes from, how I load the private parts safely, and the things that differ between M1 and M4 that will bite you.
Three sources, two of them private
| What | Where it comes from | Private? | Root? |
|---|---|---|---|
| Temperatures | IOHIDEventSystemClient (HID temperature services) | Yes | No |
| CPU, GPU, ANE, DRAM watts | IOReport “Energy Model” group | Yes | No |
| CPU cluster and GPU clocks | IOReport performance-state residency + pmgr tables in the IORegistry | Yes (IOReport) | No |
| Fans, voltages, system power | AppleSMC via IOKit | No | Read: no. Write: yes |
| GPU utilization | IOAccelerator “PerformanceStatistics” | No | No |
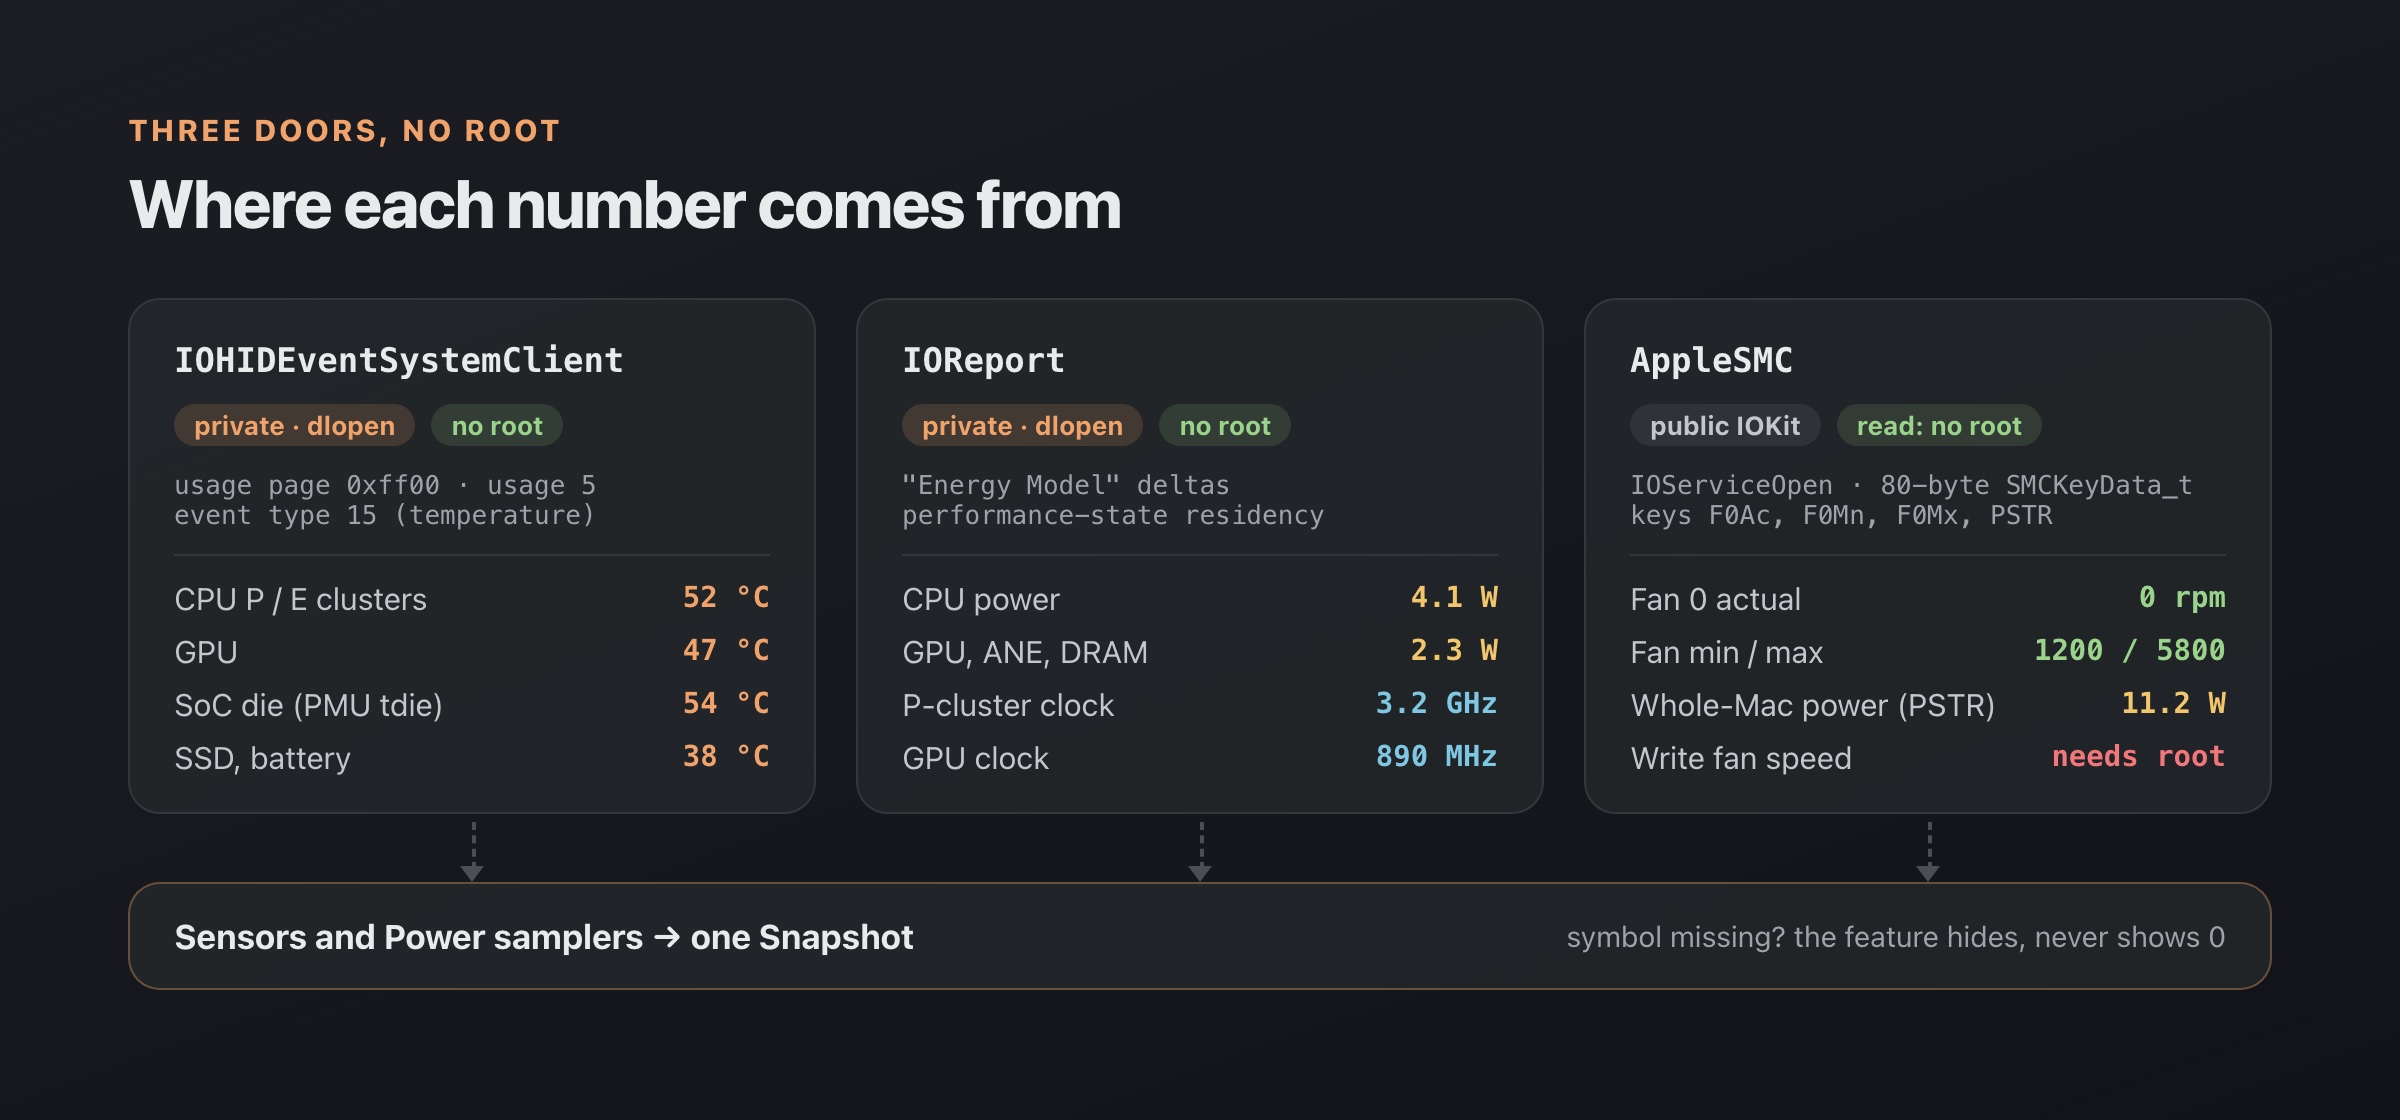
Three doors, no root: two private frameworks loaded with dlopen, and the public AppleSMC user client.
None of this is new territory. Open-source tools like Stats and macmon use these routes too, and the macmon project in particular showed that IOReport gives you powermetrics-style power numbers without sudo. What I want to share is the shape of a version that’s safe to ship and cheap to run.
Rule one: dlopen everything private
Private APIs can change or disappear in any macOS update. If you link them directly and a symbol goes away, your app doesn’t launch. So nothing private is linked. Each source resolves its symbols at runtime with dlopen / dlsym, and its initializer is failable:
init?() {
    guard let h = dlopen("/usr/lib/libIOReport.dylib", RTLD_NOW) else { return nil }
    func sym<T>(_ name: String, _: T.Type) -> T? {
        guard let p = dlsym(h, name) else { return nil }
        return unsafeBitCast(p, to: T.self)
    }
    guard let copyChannels = sym("IOReportCopyChannelsInGroup", CopyChannelsFn.self),
          let createSamples = sym("IOReportCreateSamples", CreateSamplesFn.self)
          /* … */ else { return nil }
    // …
}
If any symbol is missing, init returns nil, the sampler reports isAvailable == false, the scheduler never runs it, and the snapshot’s capability flags tell the UI to hide that feature. A user on some future macOS where IOReport broke would see no power readings, not a crash. Sensors that don’t resolve are hidden too, never shown as 0, because a 0 °C CPU is worse than no reading.
The function pointers are declared as @convention(c) typealiases using raw pointers for every CF object. That keeps the signatures trivially representable, and ownership is handled explicitly with Unmanaged (takeRetainedValue for Copy/Create functions, takeUnretainedValue for Get functions).
Temperatures: IOHIDEventSystemClient
Apple Silicon exposes its thermal sensors as HID services. The symbols live in IOKit but aren’t in the public headers, so they’re looked up the same way. The flow is:
IOHIDEventSystemClientCreate, thenIOHIDEventSystemClientSetMatchingwithPrimaryUsagePage: 0xff00(Apple vendor) andPrimaryUsage: 5(temperature sensor).IOHIDEventSystemClientCopyServicesonce, and read each service’sProductproperty for its name.- Per read:
IOHIDServiceClientCopyEventwith event type 15 (temperature), thenIOHIDEventGetFloatValuewith field15 << 16.
func temperature(at i: Int) -> Double? {
    guard let svc = CFArrayGetValueAtIndex(services, i),
          let ev = copyEvent(svc, 15, 0, 0) else { return nil }
    let v = getFloat(ev, 15 << 16)
    Unmanaged<AnyObject>.fromOpaque(ev).release()
    guard v.isFinite, v > 0, v < 150 else { return nil }
    return v
}
The sanity bound matters. You will occasionally get garbage, and throwing out anything non-finite, non-positive or over 150 °C is cheaper than explaining a 4,000 °C spike in a chart.
Sensor names are the hard part
What comes back is a list of product names like pACC MTR Temp Sensor0, eACC MTR Temp Sensor3, GPU MTR Temp Sensor1, PMU tdie, NAND CH0 temp, gas gauge battery. Which ones exist, and how many, depends on the chip. There’s no “CPU temperature” sensor. You decide what “CPU temperature” means.
Stat Space maps names with a prefix table. Each entry has a group, a display name, an optional role (cpu, gpu, ssd, battery) and a priority:
{ "prefix": "pACC MTR Temp Sensor", "group": "CPU", "name": "CPU P-core", "role": "cpu", "priority": 1 },
{ "prefix": "PMU tdie", "group": "SoC", "name": "SoC die", "role": "cpu", "priority": 2 },
{ "prefix": "GPU MTR Temp Sensor", "group": "GPU", "name": "GPU", "role": "gpu", "priority": 1 }
The CPU summary is the mean of the best-priority sensors present: the P-core and E-core cluster sensors if the chip has them, the PMU die sensors only as a fallback. The longest matching prefix wins. Because the table will be wrong on some chip I haven’t seen, it ships embedded but can be overridden by a JSON file in Application Support, so fixing a new Mac is a data change, not a release.
If you’re comparing numbers between apps, this is why they disagree: different apps average different sensors. Neither is lying. There’s a guide on what the readings mean at https://statspace.app/guides/apple-silicon-normal-temperature.
Power: IOReport energy deltas
IOReport is the kernel’s reporting framework, and it’s where powermetrics-style numbers come from. Power isn’t reported directly. Energy is. The steps:
IOReportCopyChannelsInGroup("Energy Model")once.IOReportCreateSubscriptiononce. The subscription lives as long as the process.- Every sample:
IOReportCreateSamples, thenIOReportCreateSamplesDelta(previous, current). - Walk the delta’s channels, read each with
IOReportSimpleGetIntegerValue, convert to joules, divide by elapsed seconds.
The first call only primes the baseline and returns nothing. That also means after a suspend (nothing on screen needs power), the baseline is dropped and the next sample primes again, rather than dividing a ten-minute energy delta by a two-second interval.
Channels are classified by name once, and only again if the channel count changes:
*CPU Energyis CPU. The suffix match covers Ultra chips, which report one per die asDIE_n_CPU Energy.GPU Energyis GPU. Some chips have only a channel calledGPU, so that’s a fallback, used only whenGPU Energyis absent.ANE*is the Neural Engine,DRAM*is memory.
Units come from IOReportChannelGetUnitLabel (mJ, µJ, nJ). When the label is missing, macOS reports mJ on M1 through M4, so that’s the default. Package power is CPU + GPU + ANE + DRAM.
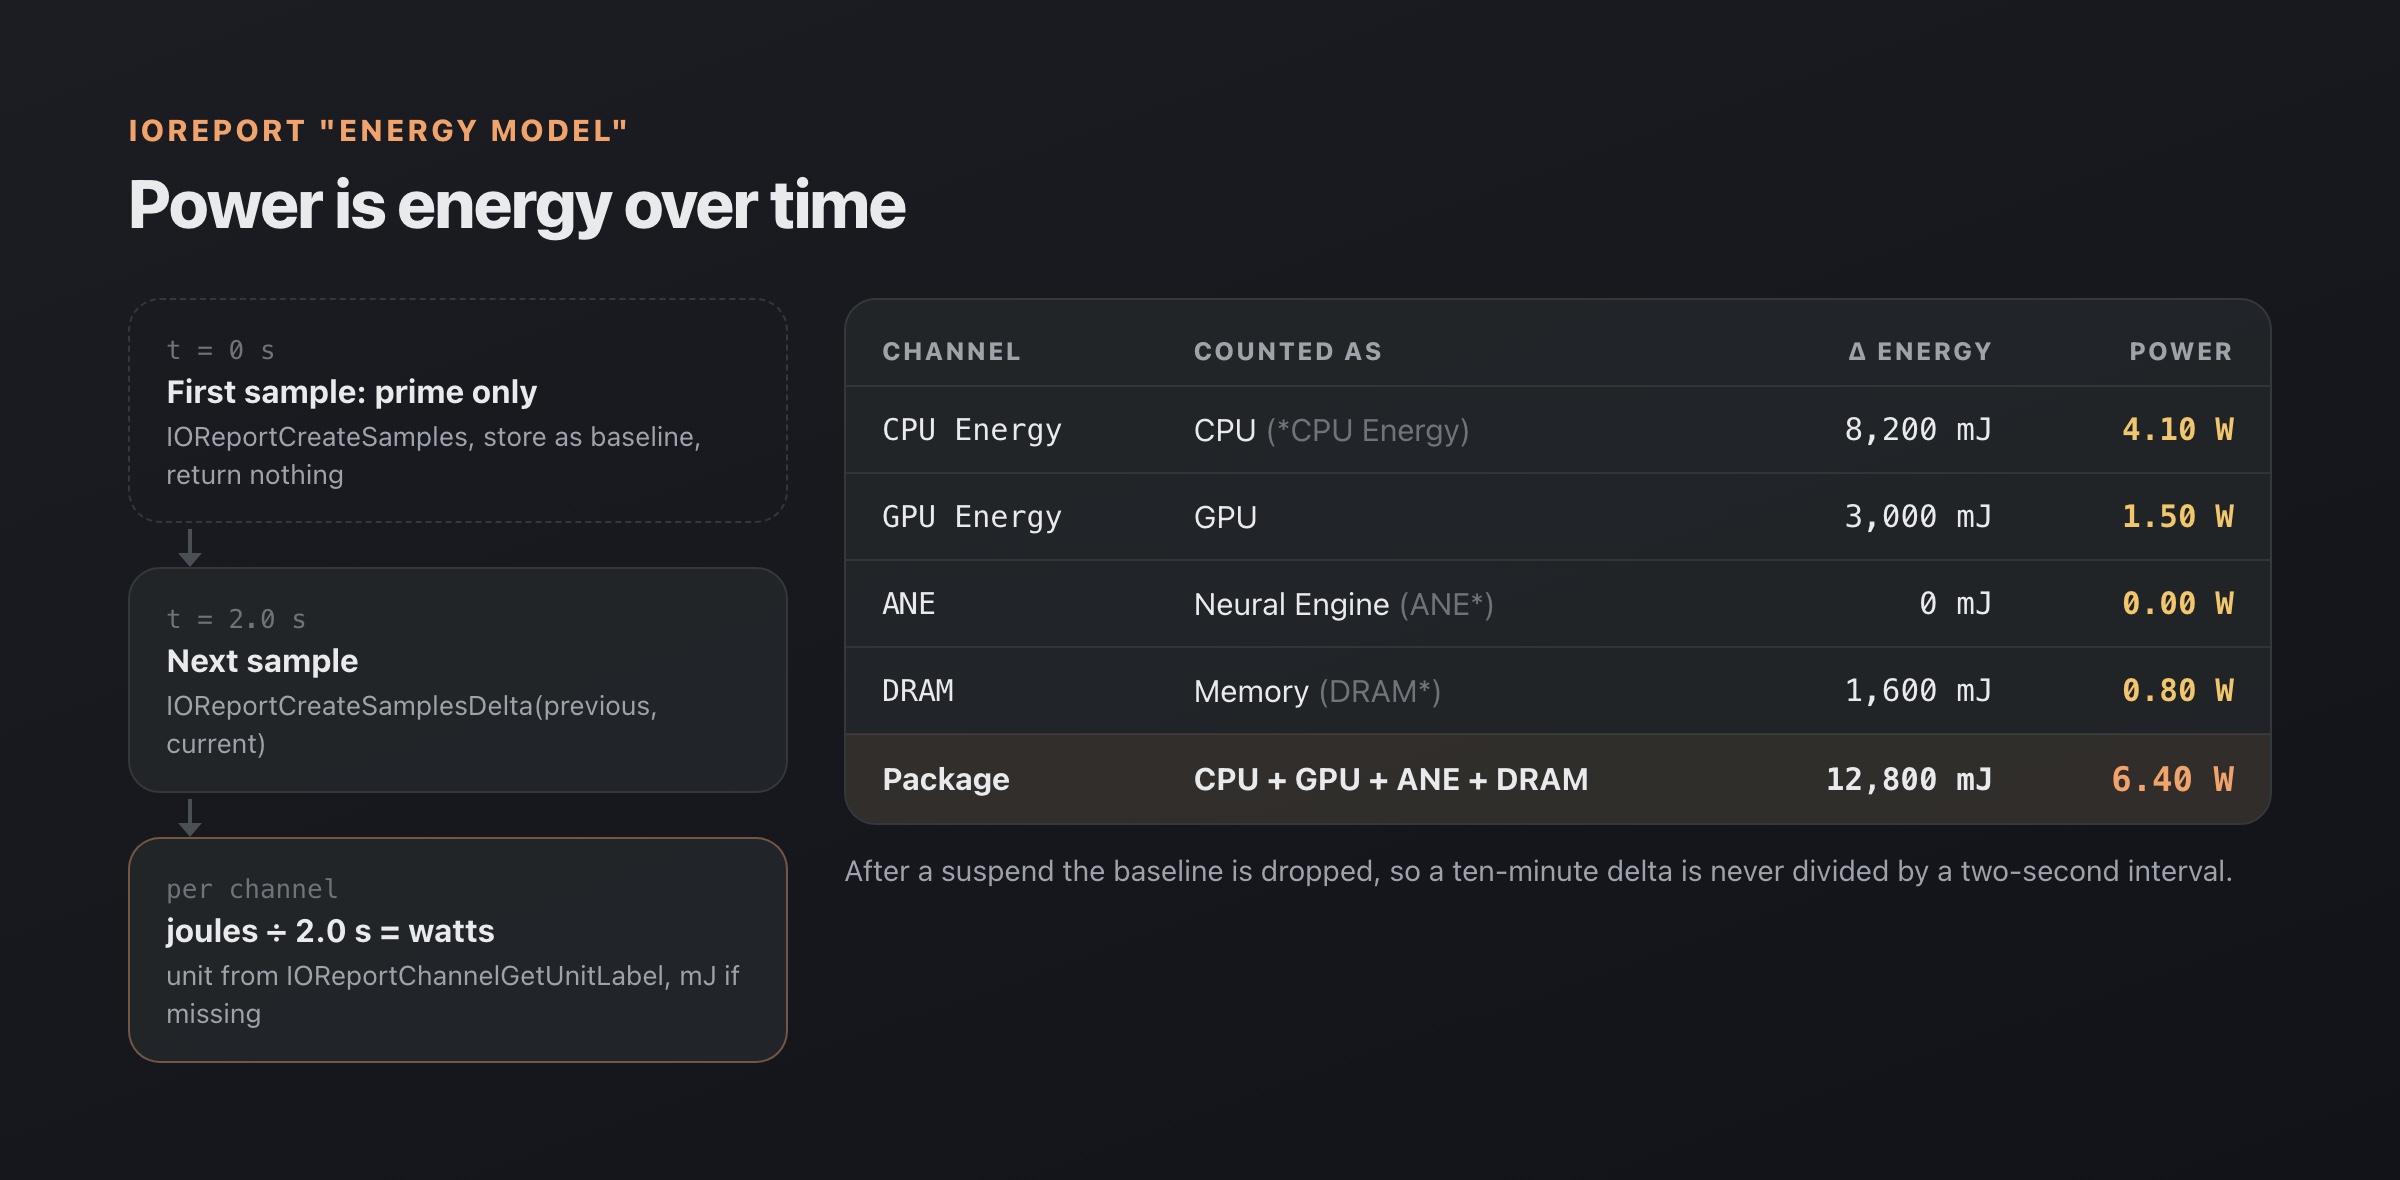
Watts are energy deltas divided by elapsed time; the first sample only primes the baseline.
Whole-Mac power is a different number
IOReport gives you the SoC’s rails. The whole Mac (display, SSD, everything) is a separate SMC key, PSTR. Stat Space 1.4.0 added it as its own menu bar item after a user asked for it, since the existing item showed processor power only. PSTR isn’t readable on every Mac, so the app probes it once at startup and hides the option where it fails.
Clocks: residency times a frequency table
There’s no “current CPU MHz” value either. IOReport’s “CPU Stats / CPU Complex Performance States” channels report how long each cluster spent in each state: IDLE, OFF, then a list of DVFS (frequency/voltage) states. The GPU has the same under “GPU Stats / GPU Performance States”.
The frequencies for those states live in the IORegistry, on the pmgr service: voltage-states1-sram for the E-cluster, voltage-states5-sram for the P-cluster, voltage-states9 for the GPU. They’re arrays of (frequency, voltage) pairs. The average active clock over an interval is:
MHz = Σ (residency in state i × frequency of state i) / Σ residency in active states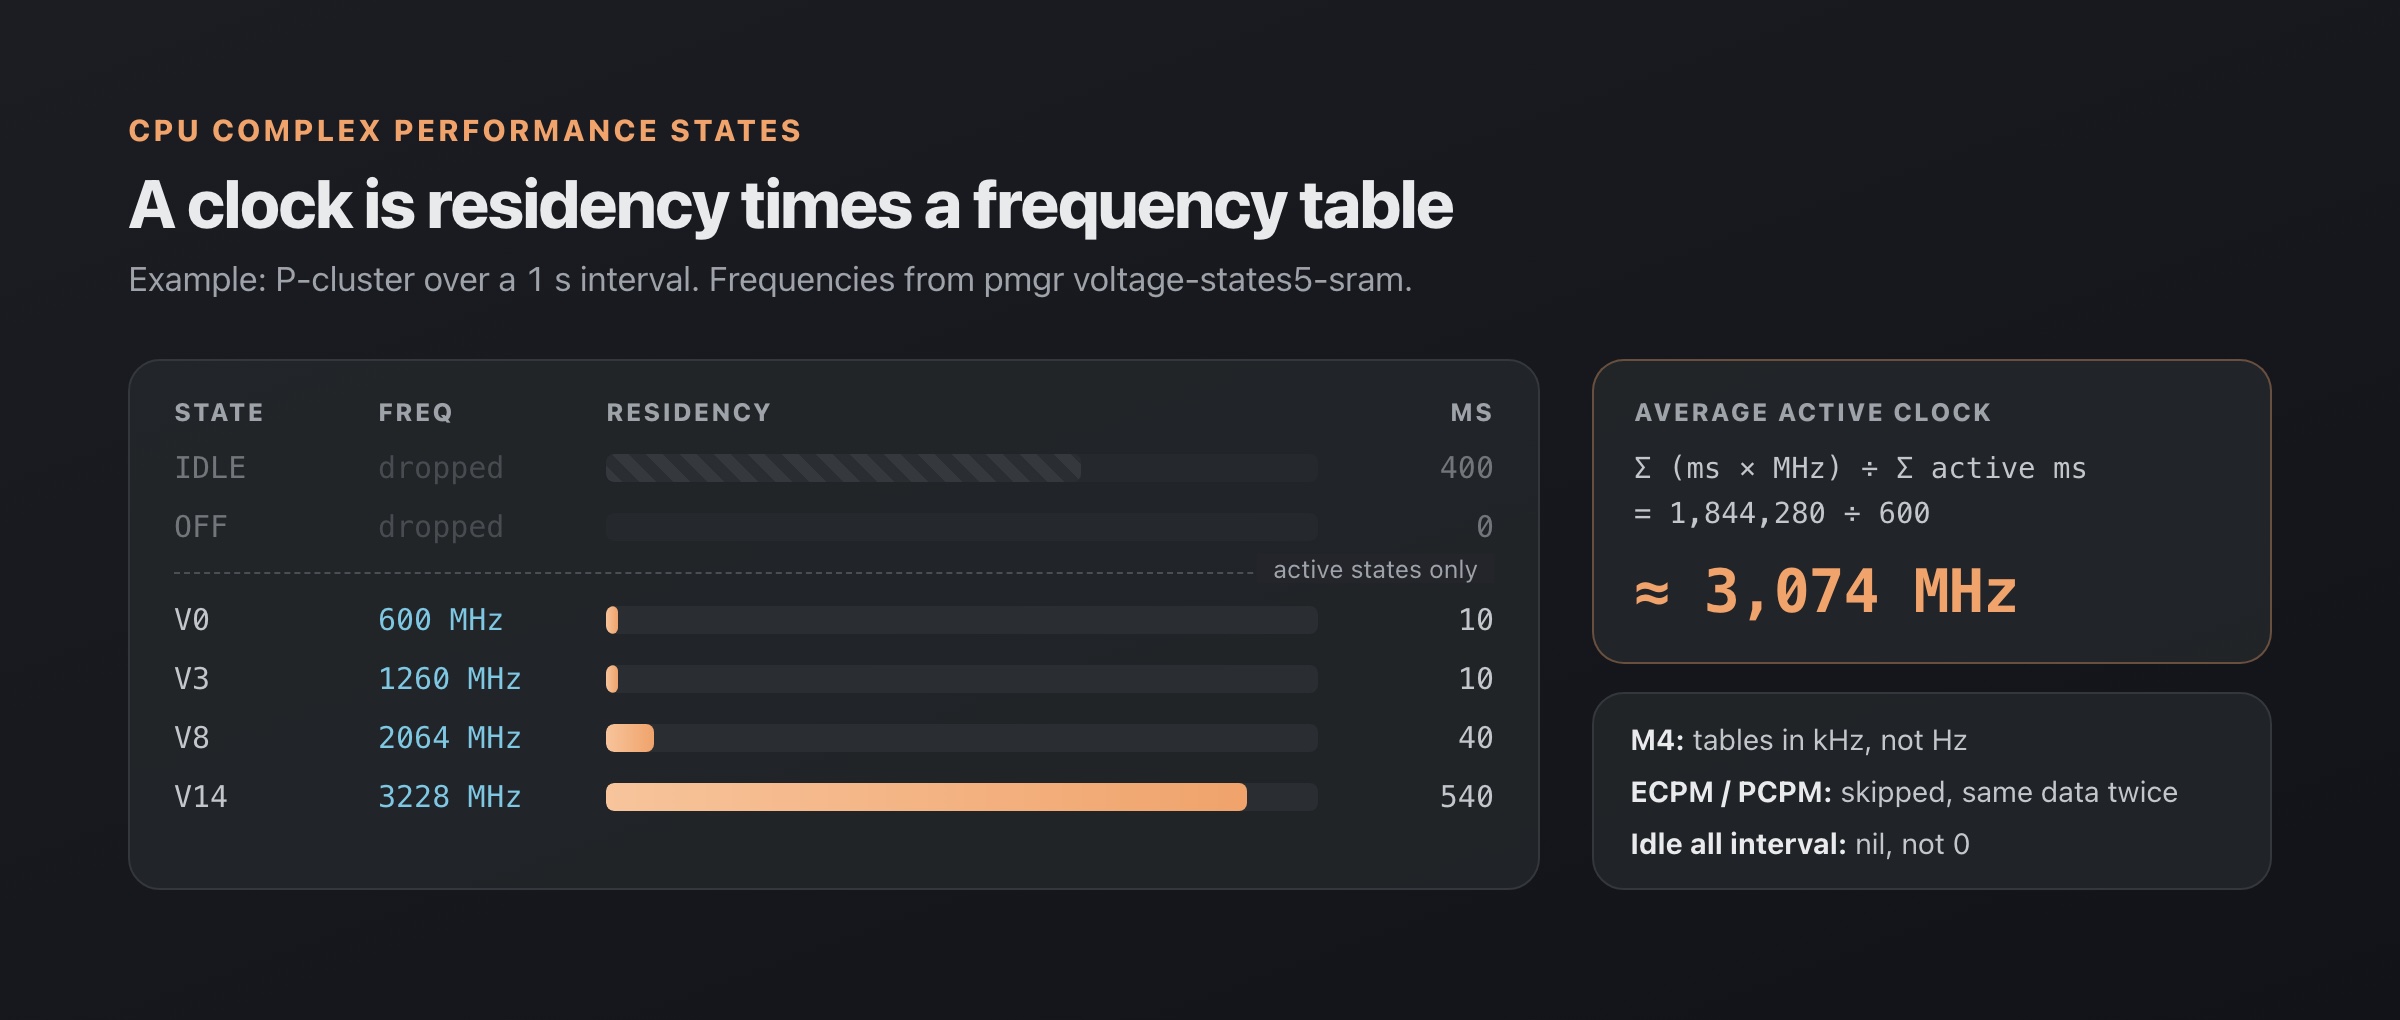
The average active clock weights each DVFS state’s frequency by how long the cluster spent in it.
Pitfalls I hit here:
- Skip the idle states. Leading
IDLE,OFFandDOWNstates are dropped before indexing into the frequency table, otherwise every index is off by one or two. - Units changed on M4. The pmgr tables are in Hz on earlier chips and kHz on the M4 family. The code checks the magnitude of the largest entry to decide.
- Duplicate views.
ECPM/PCPMchannels are the clusters’ power-manager views of the same thing. Count them and you double the weight. OnlyECPU*,PCPU*andGPUPHare used. - Idle means no clock. If a cluster was idle the whole interval there’s no meaningful average, so it’s
nil, not 0.
Fans and the SMC: public, but fiddly
The SMC isn’t private in the dlopen sense. It’s an IOKit user client you open with IOServiceOpen on AppleSMC, then call with a parameter block that has to match the C SMCKeyData_t exactly: 80 bytes. Swift lays out nested structs by size, not stride, so I needed explicit padding to put the result field at the right offset, and an assertion that the struct is 80 bytes.
Each key is four characters packed into a big-endian UInt32 (F0Ac is fan 0 actual RPM, F0Mn / F0Mx its min and max). On Apple Silicon, flt values are little-endian Float32, while integer and fixed-point types are big-endian. Mix those up and you get nonsense values that look like real numbers.
Reading works as a normal user. Writing doesn’t: forcing a fan speed needs root, and on Apple Silicon also needs a test-mode key set to take manual control from the system’s thermal daemon. That’s why fan control is the one root component in Stat Space, an opt-in helper installed only when you turn it on (https://statspace.app/features/fan-control). Fanless Macs simply have no fan keys, and the fan UI hides.
Sampling cost: the sensor list is not free
The surprise for me was how expensive temperatures are. Each HID temperature read is a kernel round trip of roughly a millisecond, and a chip can expose dozens of sensors. A full pass costs tens of milliseconds, every time. At 1 s sampling that alone would blow a 0.3% idle CPU budget.
So sensors have a lite mode, used whenever nothing on screen shows the full sensor list (for example, only the menu bar temperature or a background alert needs it):
- Keep only the best-priority CPU and GPU sensors, the ones that feed the summary values.
- Read at most four of them per tick, in rotation. The rest keep their last value, so the mean stays whole.
- Read the fans, skip the SMC voltage list.
Sensors and power also run slower than CPU: every 2 s with the popover open, 5 s for a menu bar item, 10 s if only a background feature needs them, and off otherwise. Temperatures don’t change fast enough to justify more.
What I’d pass on
powermetricsneeds root; IOReport, HID sensors and SMC reads don’t.dlopenevery private symbol and make each feature disappear cleanly when loading fails.- Treat sensor names as data. Ship a table, let it be updated without a release.
- Power is energy over time. Prime the baseline, and re-prime after any pause.
- Check units every chip generation. M4 changed the frequency tables.
- Budget the reads. A thermometer that costs a percent of CPU is heating the thing it measures.
Stat Space is the menu bar monitor where I put all of this together: a free, lean system monitor for Apple Silicon with a one-time Pro upgrade. If you just want to know how hot your Mac is right now, the guide at https://statspace.app/guides/check-mac-temperature covers that, and the app is at https://statspace.app.
Questions
Does reading Mac temperatures need root?
No. On Apple Silicon, temperature sensors are readable through IOHIDEventSystemClient as a normal user. powermetrics needs root, but it isn't the only way in.
How do tools show CPU and GPU watts without sudo?
They read the IOReport "Energy Model" counters, take two samples, and divide the energy difference by the elapsed time. That is the approach macmon popularized.
Can fan speed be changed without root?
Reading fan speed from the SMC works as a normal user. Writing to the SMC to force a fan speed needs root, which is why Stat Space's fan control is an opt-in helper.
Know what your Mac is doing, without adding to it.
Free, no account. Pro is $9.99 once for the first 100 buyers.